
Luxury Homes for Sale in Miami County, KS
· 20 homes fit this search20 homes fit this search · Sorted by Newest Listed
Real estate in Miami County, Kansas
Miami County, KS has about 13,738 households and a median household income of $89,000. Roughly 78% of homes are owner-occupied, the median owner's home value is $287,700, 31% of adults hold a bachelor's degree or higher. The average commute runs 30.0 minutes. About 34,938 people live in Miami County, KS, per the U.S. Census Bureau's American Community Survey 5-year estimate (2020–2024). New construction is still adding supply: 12 building permits were issued in September 2026.
The first question most Miami County buyers wrestle with is whether the extra 30-to-45-minute drive from Kansas City is worth what they get in return. The honest answer: if a half-acre yard, a real front porch, and a mortgage payment that doesn't make you wince sounds like a fair trade for a longer commute, Miami County usually delivers. If proximity to downtown KC is non-negotiable, it probably isn't the right fit. That clarity saves everyone time.
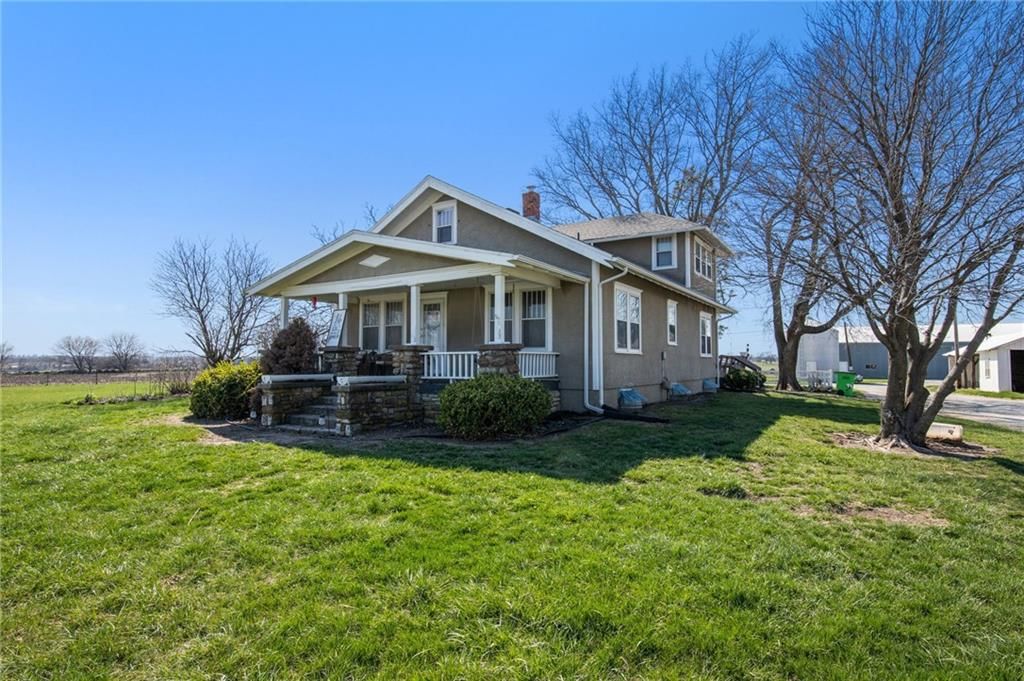
The wide vintage range matters: buyers willing to take on a 1940s bungalow with good bones can stretch their budget considerably, while buyers who want something built in the last decade will find it too, particularly in Spring Hill and Louisburg.
Spring Hill sits at the northern edge of the county and functions almost like a Johnson County suburb that ran out of room — it has newer subdivisions, strong USD 230 schools, and the shortest commute of any Miami County city into Overland Park or Olathe. Louisburg, a few miles south, is a step quieter and a step more affordable, anchored by its own well-regarded school district and a genuinely small-town feel that still has a coffee shop and a hardware store on the square. Paola is the county seat and the most self-contained community here — it has its own hospital, a historic downtown, and some of the most affordable price points in the county, especially in older neighborhoods near the town center. Osawatomie carries a significant piece of Kansas history and offers some of the lowest entry prices in the county, though buyers should budget for updates in older homes. Wellsville, Edgerton, and the smaller communities like Bucyrus and Fontana tend to attract buyers specifically looking for rural character, larger lots, and privacy over convenience.
Sellers with updated kitchens, a usable outdoor space, or a location inside Spring Hill or Louisburg school boundaries have the clearest advantage.
For buyers, the pace of the market is actually a gift that many overlook. Having time to inspect thoroughly, negotiate repairs, and make considered decisions is rare in the KC metro. Miami County right now allows that. The commute trade-off is real, but for buyers who work hybrid schedules or remote, Miami County has quietly become one of the better-value calls in the entire Kansas City region.
Housing market trends in Miami County, Kansas
| Measure | Oct 2026 | Sep 2026 | Oct 2025 |
|---|---|---|---|
| Median sale price | $351,450 | $364,500 | $327,500 |
| Median price per sq ft | $178 | $180 | $189 |
| Median days to contract | 28 | 26 | 23 |
| Sell-to-list ratio | 100% | 99% | 99% |
| Homes sold | 54 | 50 | 34 |
| New listings | 71 | 78 | 62 |
| Went under contract | 49 | 52 | 42 |
Popular home searches in Miami County
| Search | For sale |
|---|---|
| Open houses | For sale7 |
| Luxury homes | For sale20 |
| Just listed homes | For sale13 |
| Price-reduced homes | For sale99 |
| Coming soon homes | For sale7 |
| Homes under contract | For sale67 |
How we compute these
- For sale.
- Homes listed as active right now. A live count, not a monthly average.
Homes by price in Miami County
| Price range | For sale |
|---|---|
| Under $200,000 | For sale81 |
| Under $300,000 | For sale122 |
| Under $400,000 | For sale151 |
| Under $500,000 | For sale182 |
How we compute these
- For sale.
- Homes listed as active right now. A live count, not a monthly average.
Search homes in Miami County
| City | Market (Market type is set by months of supply — how long it would take to sell every home for sale at the current pace. Under ~4 months favors sellers (low inventory, faster sales, homes near or above asking); over ~6 favors buyers (more choice, more negotiating room). 4–6 is balanced.) | Months supply | Median list | Sell-to-list | Days to contract | For sale | Coming soon | Under contract |
|---|---|---|---|---|---|---|---|---|
| Paola | Balanced | 4.5 mo | Median$292,500 | 95% | 42d | 89 | 1 | 23 |
| Louisburg | Balanced | 5.4 mo | Median$289,000 | 96% | 24d | 64 | 2 | 29 |
| Spring Hill | Balanced | 4.4 mo | Median$475,318 | 98% | 29d | 170 | 4 | 75 |
| Osawatomie | Buyer's | 6.1 mo | Median$205,000 | 96% | 49d | 45 | 0 | 7 |
| Bucyrus | Strong Buyer's | 10 mo | Median$971,510 | 95% | 21d | 22 | 2 | 4 |
How we compute these
- Market.
- Market type is set by months of supply — how long it would take to sell every home for sale at the current pace. Under ~4 months favors sellers (low inventory, faster sales, homes near or above asking); over ~6 favors buyers (more choice, more negotiating room). 4–6 is balanced.
- Months supply.
- How many months it would take to sell every home now for sale at the pace of the last 90 days: homes for sale ÷ (closings in the last 90 days ÷ 3).
- Median list.
- The middle asking price among the homes for sale right now. Half are listed above it, half below.
- Days to contract.
- The middle number of days between a home being listed and going under contract, over the last 90 days of closings. It is not days-to-close, and it is not how long today's listings have been sitting. Newly built homes are excluded, because a build finishing is not a market moving.
- For sale.
- Homes listed as active right now. A live count, not a monthly average.
- Coming soon.
- Homes announced but not yet accepting showings. A live count.
- Under contract.
- Homes with an accepted contract that have not closed yet. A live count.