
66085 (Overland Park, KS) Real Estate & Homes For Sale
· 125 homes for sale in 66085HouseLoop Vision identified 34 homes for sale in 66085 with white kitchen cabinets, 49 with a freestanding tub, 4 with a pool, 16 with a home gym, 69 with a big backyard and 38 with a finished basement, plus 4 more features. See what HouseLoop Vision found
125 homes for sale in 66085 · Sorted by Newest Listed
Real estate in 66085 in Overland Park, Kansas
Overland Park 66085 has about 4,332 households and a median household income of $152,500. Roughly 85% of homes are owner-occupied, the median owner's home value is $538,300, 61% of adults hold a bachelor's degree or higher. The average commute runs 23.5 minutes. About 11,486 people live in Overland Park 66085, per the U.S. Census Bureau's American Community Survey 5-year estimate (2020–2024).
Overland Park 66085 has 125 homes for sale right now, 1 of them coming soon, with a median list price of $777,995. These homes were built between 1965 and 2026. They range from 1,716 to 23,110 square feet.
Housing market trends in 66085 in Overland Park, Kansas
| Measure | Aug–Oct 2026 | May–Jul 2026 | Aug–Oct 2025 |
|---|---|---|---|
| Median sale price | $711,450 | $717,535 | $729,000 |
| Median price per sq ft | $241 | $240 | $231 |
| Median days to contract | 20 | 14 | 16 |
| Sell-to-list ratio | 100% | 100% | 100% |
| Homes sold, three months | 62 | 89 | 45 |
| New listings | 73 | 105 | 50 |
| Went under contract | 63 | 75 | 39 |


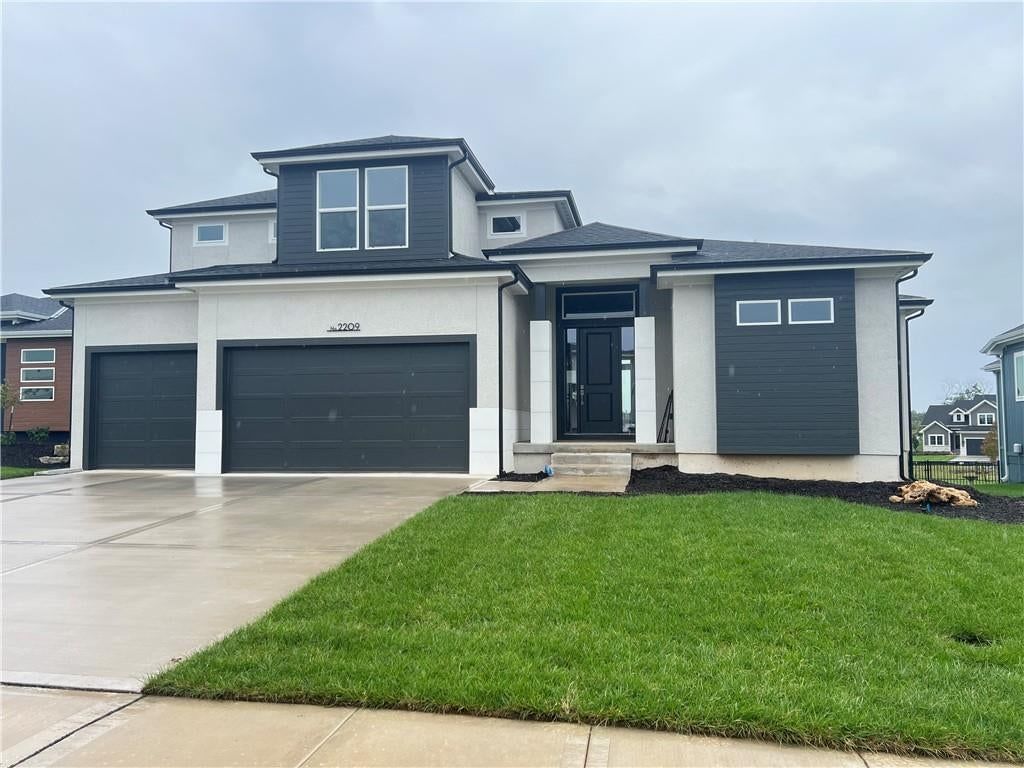


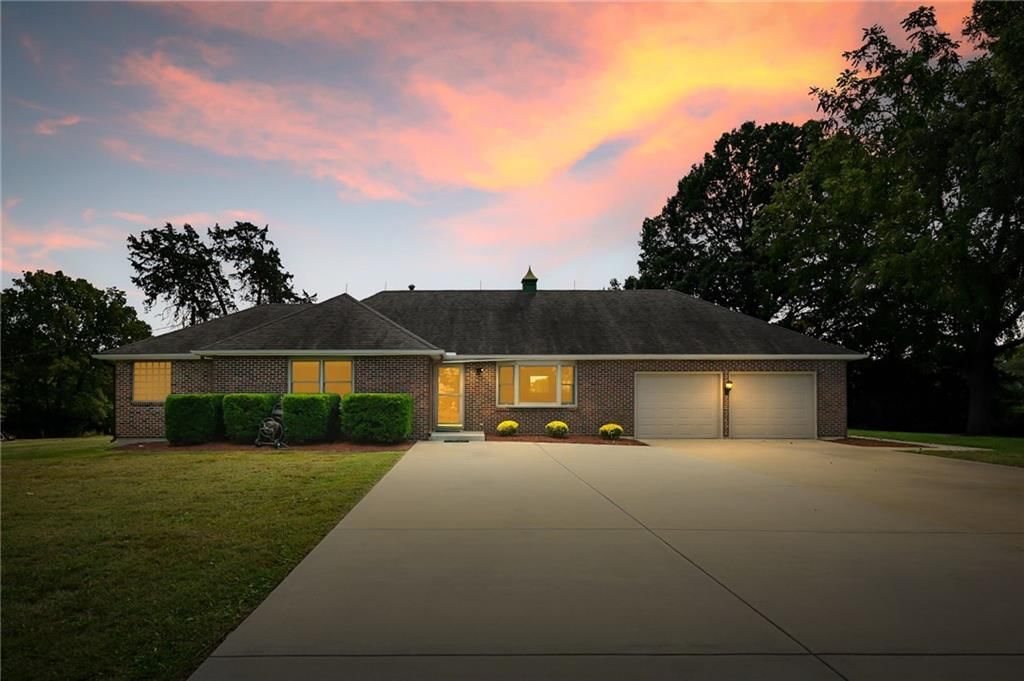
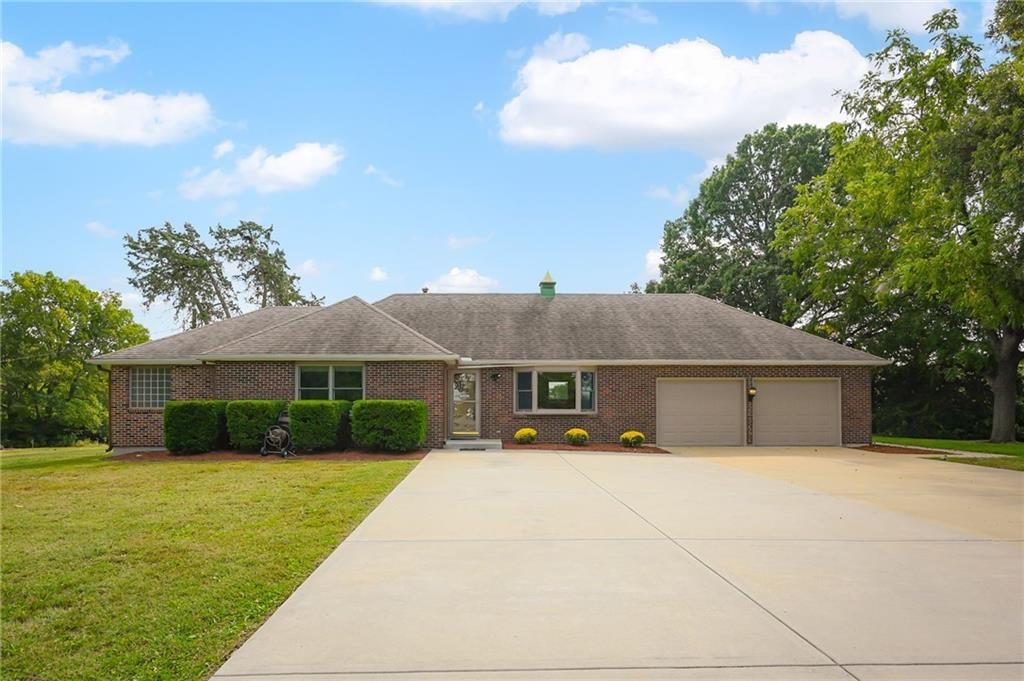
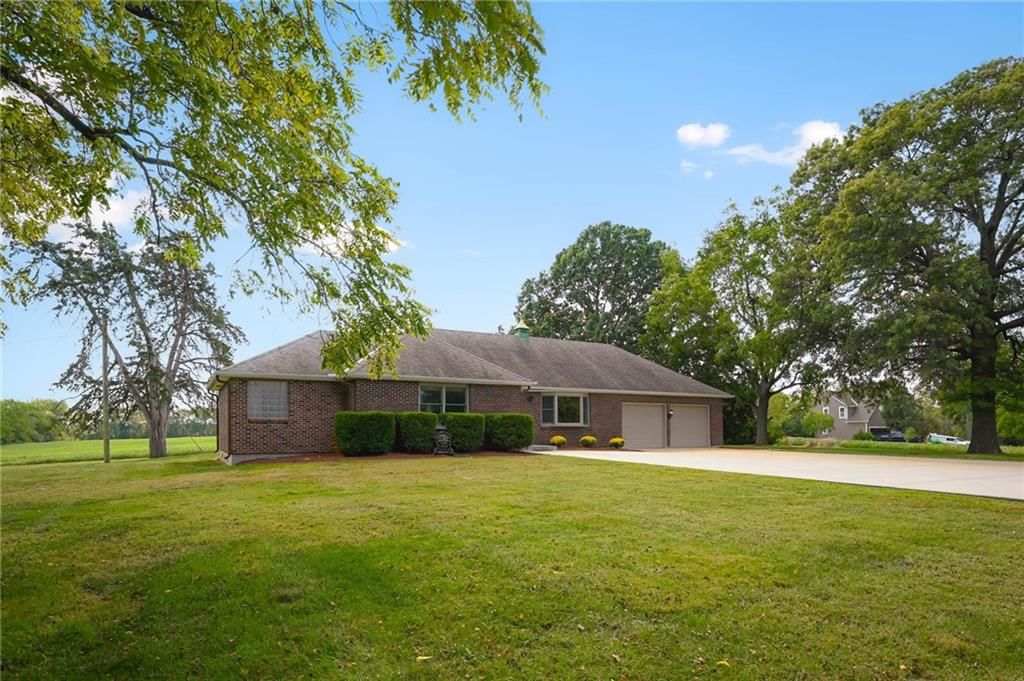


HouseLoop Vision in 66085
As of Nov 14, 2026
HouseLoop Vision identified 34 homes for sale in 66085 with white kitchen cabinets, 49 with a freestanding tub, 4 with a pool, 16 with a home gym, 69 with a big backyard and 38 with a finished basement, plus 4 more features.
HouseLoop Vision has looked at the photos of 121 of the 125 homes for sale in 66085. 4 haven't been looked at yet.
| HouseLoop Vision feature | Homes for sale | Where HouseLoop Vision saw it |
|---|---|---|
| White kitchen cabinets | 34 | 17505 Manor Street (photo 11) |
| Freestanding tub | 49 | 2501 W 176th Street (photo 37) |
| Pool | 4 | |
| Home gym | 16 | 9401 W 169th Street (photo 32) |
| Big backyard | 69 | 5211 W 164th Terrace (photo 65) |
| Finished basement | 38 | 4990 W 178th Terr (photo 45) |
| Kitchen island | 71 | 16211 Overbrook Lane (photo 2) |
| Two-story living room | 32 | 18340 Mohawk Lane (photo 17) |
| Fenced yard | 22 | 18461 Pawnee Lane (photo 43), 18504 Windsor Street (photo 5) |
| 3-car garage | 43 | 3800 W 187th Street (photo 1) |
Key HouseLoop Vision features
- White kitchen cabinets
- Freestanding tub
- Pool
- Home gym
- Big backyard
- Finished basement
- Kitchen island
- Two-story living room
- Fenced yard
- 3-car garage
Questions buyers ask about 66085
- How many homes for sale in 66085 have white kitchen cabinets?
- HouseLoop Vision identified 34 homes for sale in 66085 with white kitchen cabinets. One is 17505 Manor Street (photo 11).
- How many homes for sale in 66085 have a freestanding tub?
- HouseLoop Vision identified 49 homes for sale in 66085 with a freestanding tub. One is 2501 W 176th Street (photo 37).
- How many homes for sale in 66085 have a pool?
- HouseLoop Vision identified 4 homes for sale in 66085 with a pool.
- How many homes for sale in 66085 have a home gym?
- HouseLoop Vision identified 16 homes for sale in 66085 with a home gym. One is 9401 W 169th Street (photo 32).
- How many homes for sale in 66085 have a big backyard?
- HouseLoop Vision identified 69 homes for sale in 66085 with a big backyard. One is 5211 W 164th Terrace (photo 65).
Schools serving 66085
| School |
|---|
| School districts |
| Blue Valley USD 229 · 28 schools |
| Shawnee Mission USD 512 · 16 schools |
| Olathe USD 233 · 2 schools |
| See all 46 schools in Overland Park |
Homes by feature in 66085
| Feature | For sale |
|---|---|
| Homes with public water | For sale114 |
| Two or more stories | For sale113 |
| Homes with a public sewer | For sale88 |
| HOA under $300/mo | For sale82 |
How we compute these
- For sale.
- Homes listed as active right now. A live count, not a monthly average.
Nearby neighborhoods to Overland Park
| Neighborhood | Market (Market type is set by months of supply — how long it would take to sell every home for sale at the current pace. Under ~4 months favors sellers (low inventory, faster sales, homes near or above asking); over ~6 favors buyers (more choice, more negotiating room). 4–6 is balanced.) | Months supply | For sale | Median sale | Sell-to-list | Days to contract | Coming soon | Under contract |
|---|---|---|---|---|---|---|---|---|
| Nall Hills | Strong Seller's | 1.1 mo | 4 | Median$425,000 | 99% | 15d | 0 | 6 |
| Cherokee Hills | Strong Seller's | 0.3 mo | 1 | Median$365,000 | 101% | 13d | 1 | 3 |
| Chapel Hill | Balanced ▼ | 4.9 mo | 17 | Median$750,000 | 100% | 32d | 0 | 5 |
| Quivira Falls | Strong Seller's | 1.4 mo | 4 | Median$255,000 | 102% | 23d | 1 | 1 |
| Oak Park | Strong Seller's | 0.8 mo | 2 | Median$420,000 | 101% | 17d | 0 | 5 |
How we compute these
- Market.
- Market type is set by months of supply — how long it would take to sell every home for sale at the current pace. Under ~4 months favors sellers (low inventory, faster sales, homes near or above asking); over ~6 favors buyers (more choice, more negotiating room). 4–6 is balanced.
- Months supply.
- How many months it would take to sell every home now for sale at the pace of the last 90 days: homes for sale ÷ (closings in the last 90 days ÷ 3).
- For sale.
- Homes listed as active right now. A live count, not a monthly average.
- Days to contract.
- The middle number of days between a home being listed and going under contract, over the last 90 days of closings. It is not days-to-close, and it is not how long today's listings have been sitting. Newly built homes are excluded, because a build finishing is not a market moving.
- Coming soon.
- Homes announced but not yet accepting showings. A live count.
- Under contract.
- Homes with an accepted contract that have not closed yet. A live count.
Search homes nearby 66085
| Place | Market (Market type is set by months of supply — how long it would take to sell every home for sale at the current pace. Under ~4 months favors sellers (low inventory, faster sales, homes near or above asking); over ~6 favors buyers (more choice, more negotiating room). 4–6 is balanced.) | Months supply | Median list | Sell-to-list | Days to contract | For sale | Coming soon | Under contract |
|---|---|---|---|---|---|---|---|---|
| Overland Park | Seller's | 2.3 mo | Median$740,000 | 101% | 16d | 493 | 30 | 296 |
| Olathe | Seller's | 3 mo | Median$614,925 | 99% | 18d | 536 | 22 | 288 |
| Shawnee | Seller's | 2.5 mo | Median$526,975 | 100% | 16d | 178 | 8 | 93 |
| Lenexa | Seller's | 2.8 mo | Median$604,500 | 98% | 21d | 195 | 13 | 76 |
| Leawood | Seller's | 3.1 mo | Median$857,500 | 100% | 18d | 143 | 9 | 60 |
How we compute these
- Market.
- Market type is set by months of supply — how long it would take to sell every home for sale at the current pace. Under ~4 months favors sellers (low inventory, faster sales, homes near or above asking); over ~6 favors buyers (more choice, more negotiating room). 4–6 is balanced.
- Months supply.
- How many months it would take to sell every home now for sale at the pace of the last 90 days: homes for sale ÷ (closings in the last 90 days ÷ 3).
- Median list.
- The middle asking price among the homes for sale right now. Half are listed above it, half below.
- Days to contract.
- The middle number of days between a home being listed and going under contract, over the last 90 days of closings. It is not days-to-close, and it is not how long today's listings have been sitting. Newly built homes are excluded, because a build finishing is not a market moving.
- For sale.
- Homes listed as active right now. A live count, not a monthly average.
- Coming soon.
- Homes announced but not yet accepting showings. A live count.
- Under contract.
- Homes with an accepted contract that have not closed yet. A live count.
Nearby ZIP codes
| Place | Market (Market type is set by months of supply — how long it would take to sell every home for sale at the current pace. Under ~4 months favors sellers (low inventory, faster sales, homes near or above asking); over ~6 favors buyers (more choice, more negotiating room). 4–6 is balanced.) | Months supply | Median list | Sell-to-list | Days to contract | For sale | Coming soon | Under contract |
|---|---|---|---|---|---|---|---|---|
| 66212 | Strong Seller's | 1.2 mo | Median$358,400 | 101% | 15d | 46 | 5 | 40 |
| 66221 | Seller's | 3.6 mo | Median$980,350 | 101% | 28d | 117 | 3 | 55 |
| 66213 | Strong Seller's | 1.3 mo | Median$525,450 | 100% | 15d | 30 | 1 | 27 |
| 66223 | Strong Seller's | 1.5 mo | Median$480,000 | 99% | 16d | 30 | 2 | 26 |
How we compute these
- Market.
- Market type is set by months of supply — how long it would take to sell every home for sale at the current pace. Under ~4 months favors sellers (low inventory, faster sales, homes near or above asking); over ~6 favors buyers (more choice, more negotiating room). 4–6 is balanced.
- Months supply.
- How many months it would take to sell every home now for sale at the pace of the last 90 days: homes for sale ÷ (closings in the last 90 days ÷ 3).
- Median list.
- The middle asking price among the homes for sale right now. Half are listed above it, half below.
- Days to contract.
- The middle number of days between a home being listed and going under contract, over the last 90 days of closings. It is not days-to-close, and it is not how long today's listings have been sitting. Newly built homes are excluded, because a build finishing is not a market moving.
- For sale.
- Homes listed as active right now. A live count, not a monthly average.
- Coming soon.
- Homes announced but not yet accepting showings. A live count.
- Under contract.
- Homes with an accepted contract that have not closed yet. A live count.