
Spring Hill, KS Real Estate & Homes For Sale
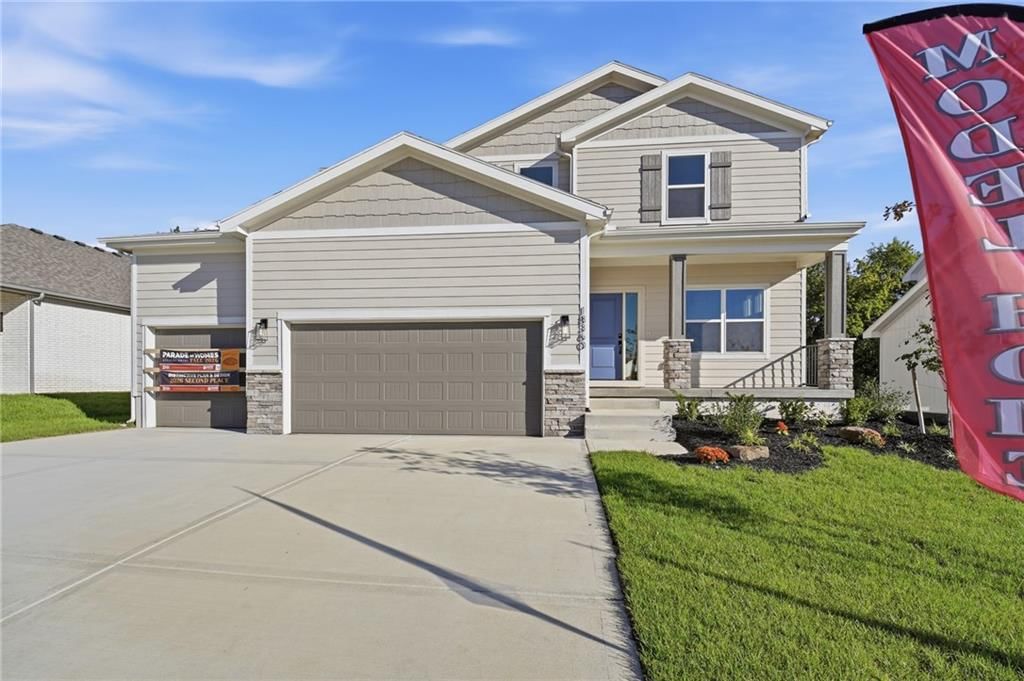
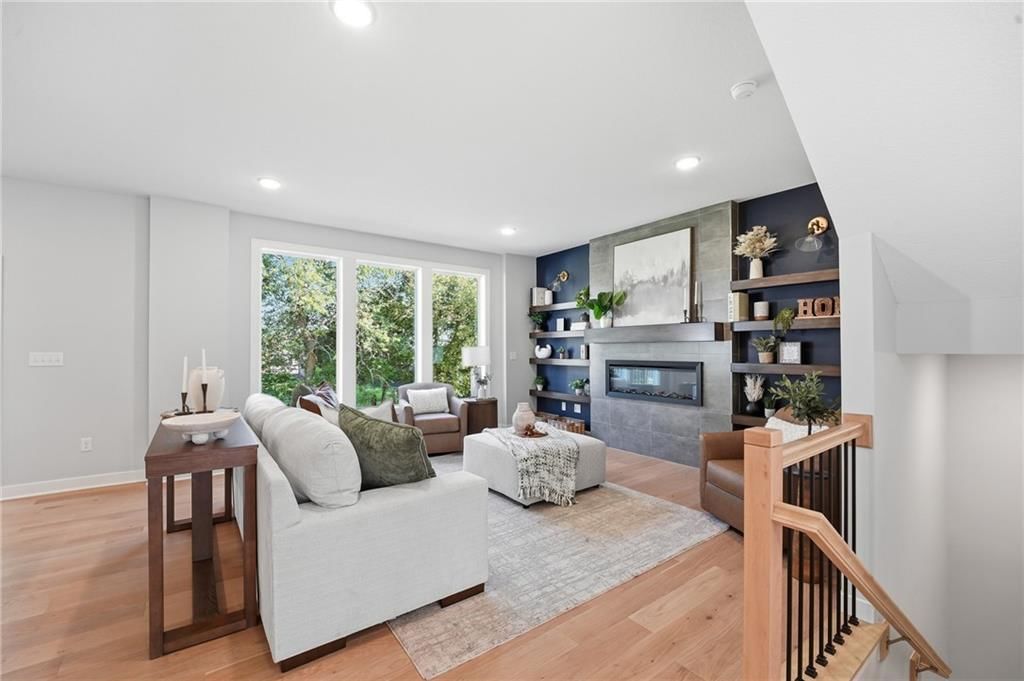
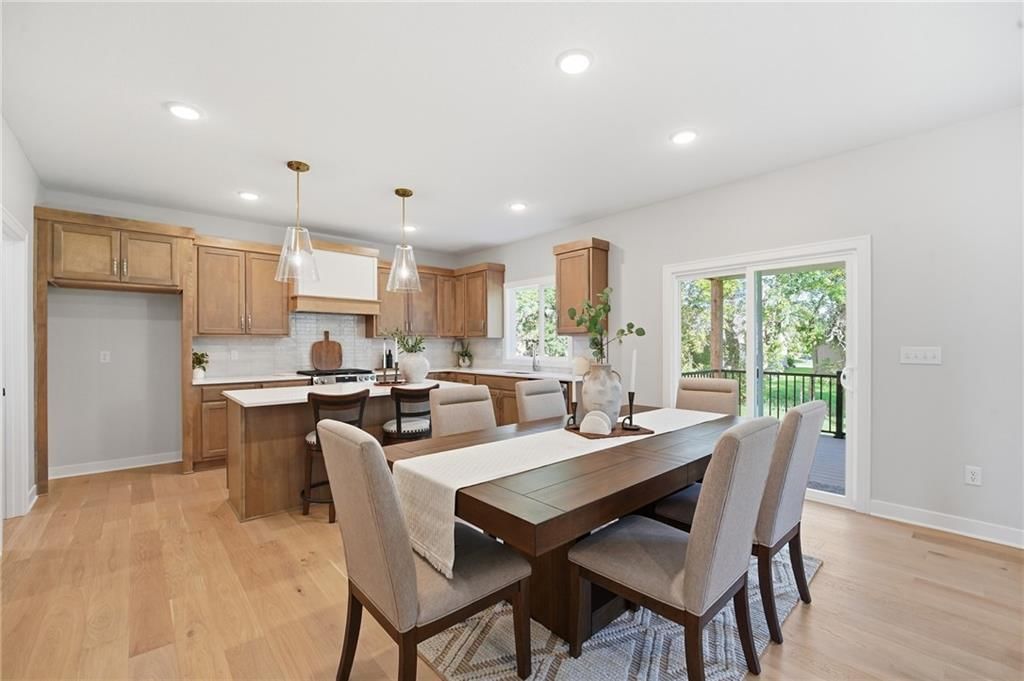
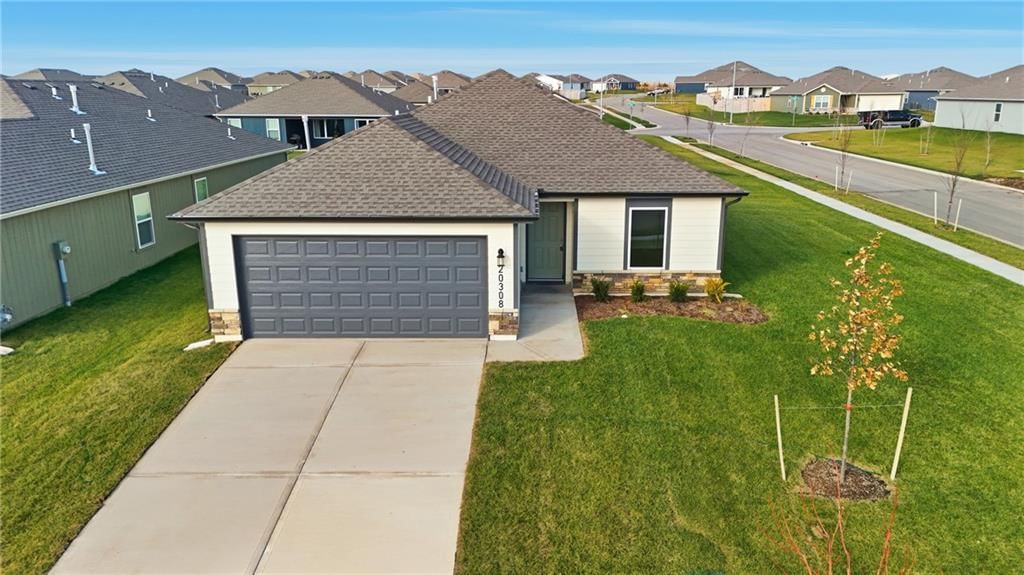
· 156 homes for sale in Spring Hill156 homes for sale in Spring Hill · Sorted by Newest Listed
Real estate in Spring Hill, Kansas
Spring Hill, KS has about 3,277 households and a median household income of $112,428. Roughly 77% of homes are owner-occupied, the median owner's home value is $357,800, 46% of adults hold a bachelor's degree or higher. The average commute runs 27.0 minutes. About 9,120 people live in Spring Hill, KS, per the U.S. Census Bureau's American Community Survey 5-year estimate (2020–2024). New construction is still adding supply: 99 building permits were issued in August 2026.
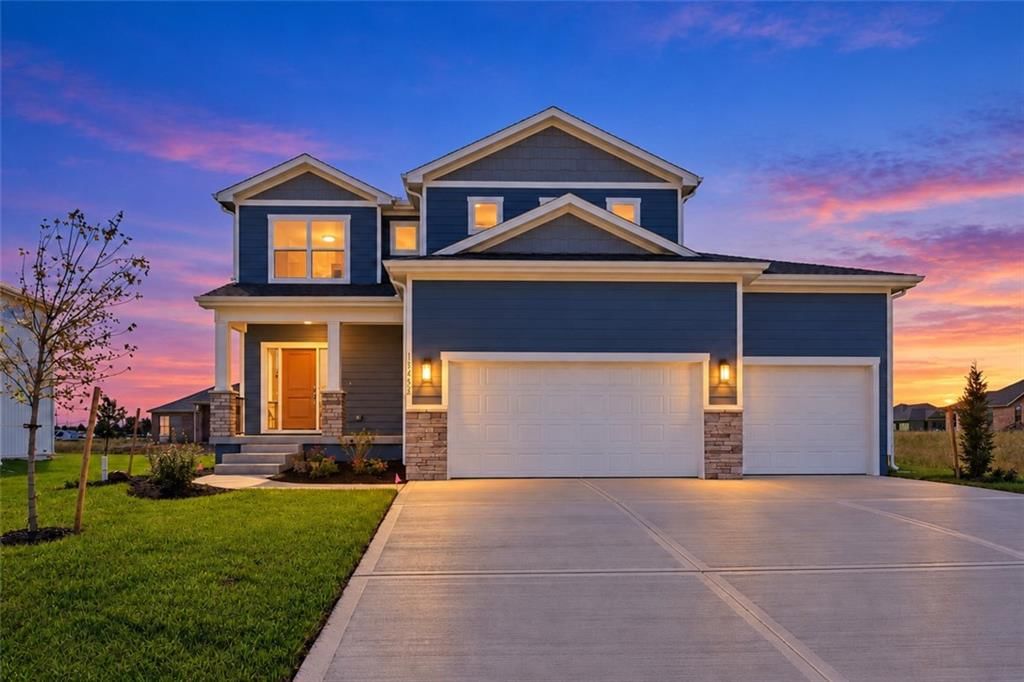
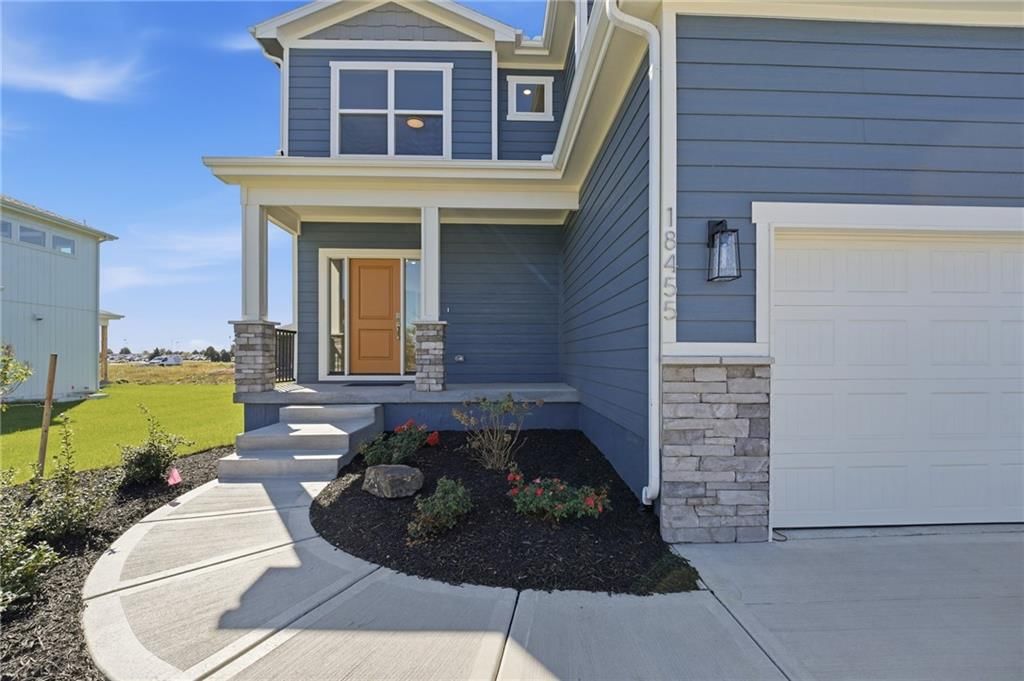
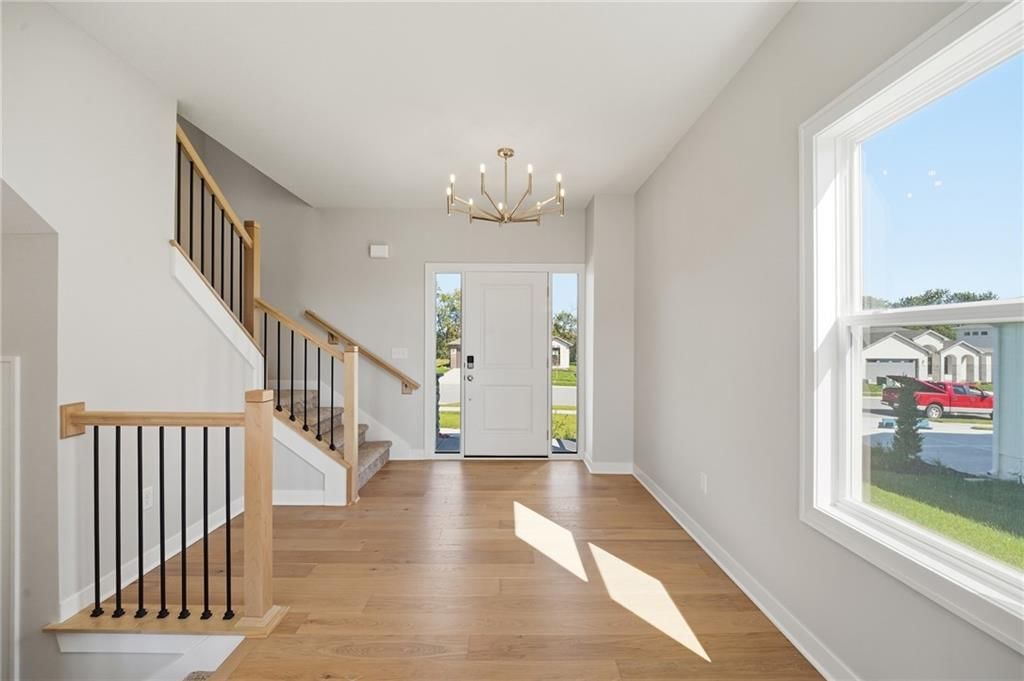
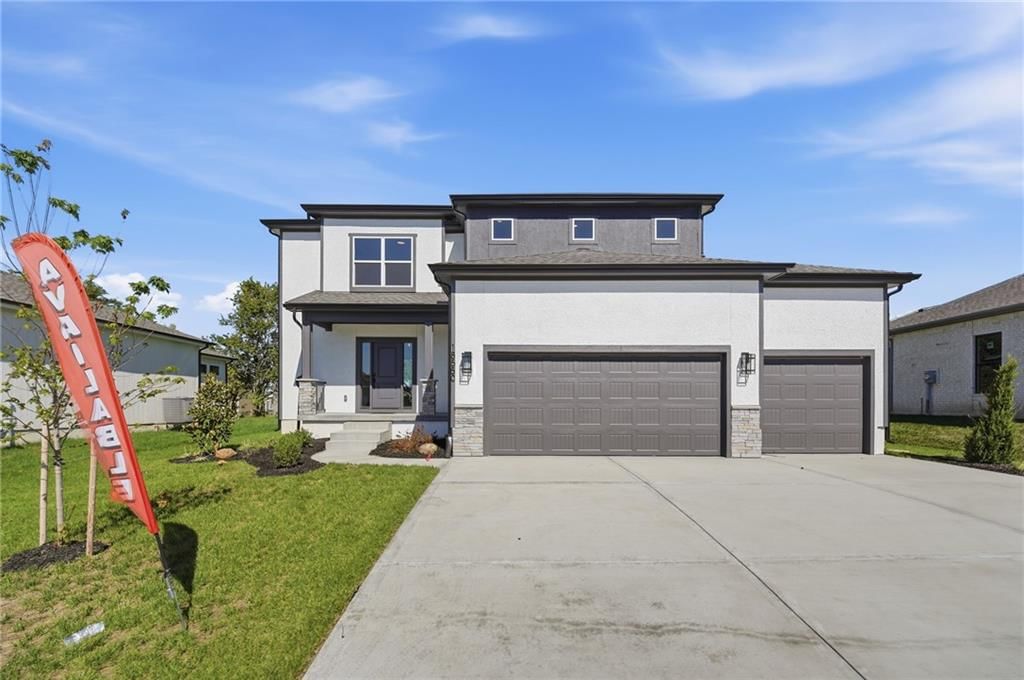
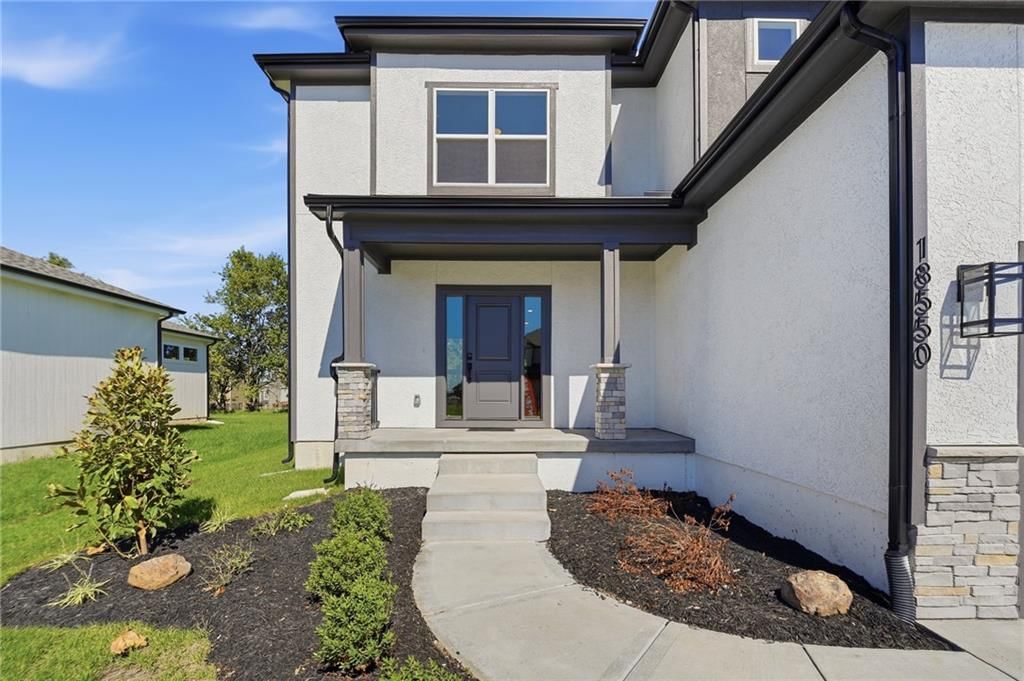
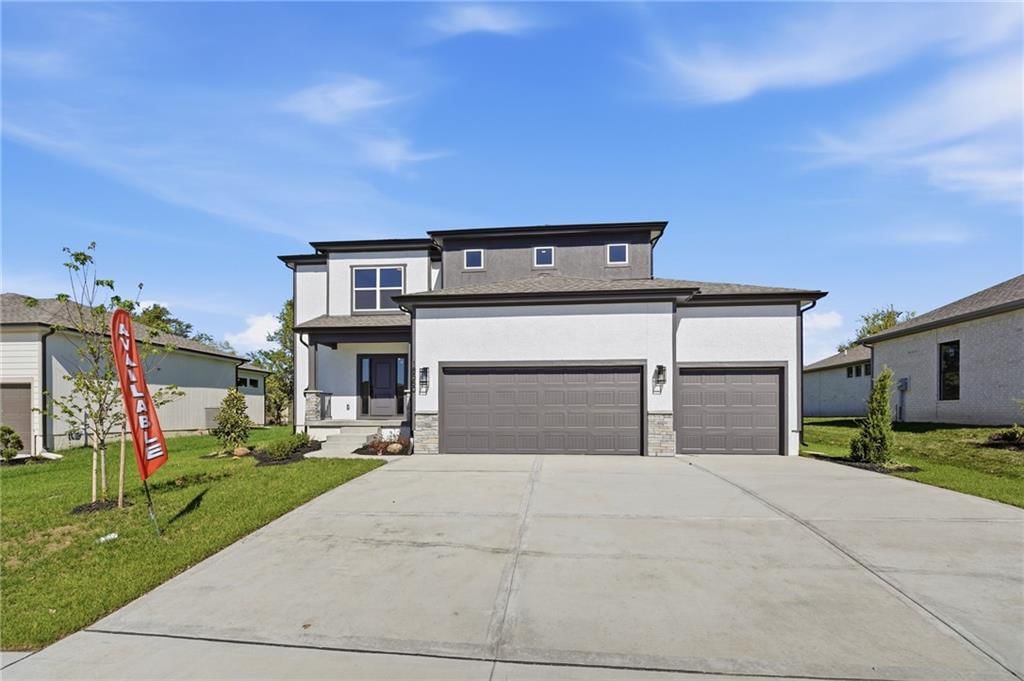
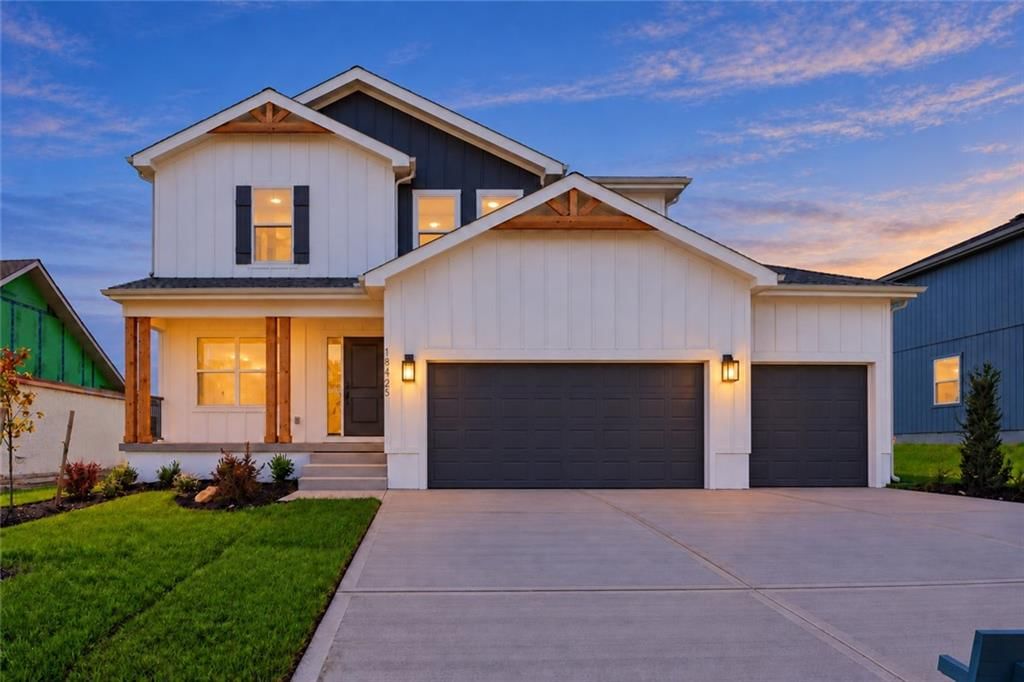
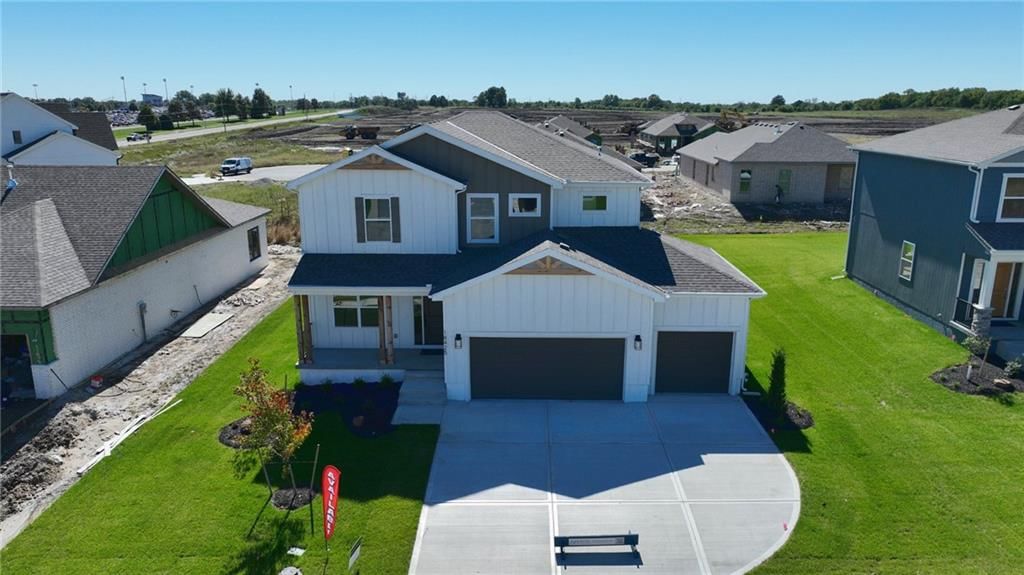
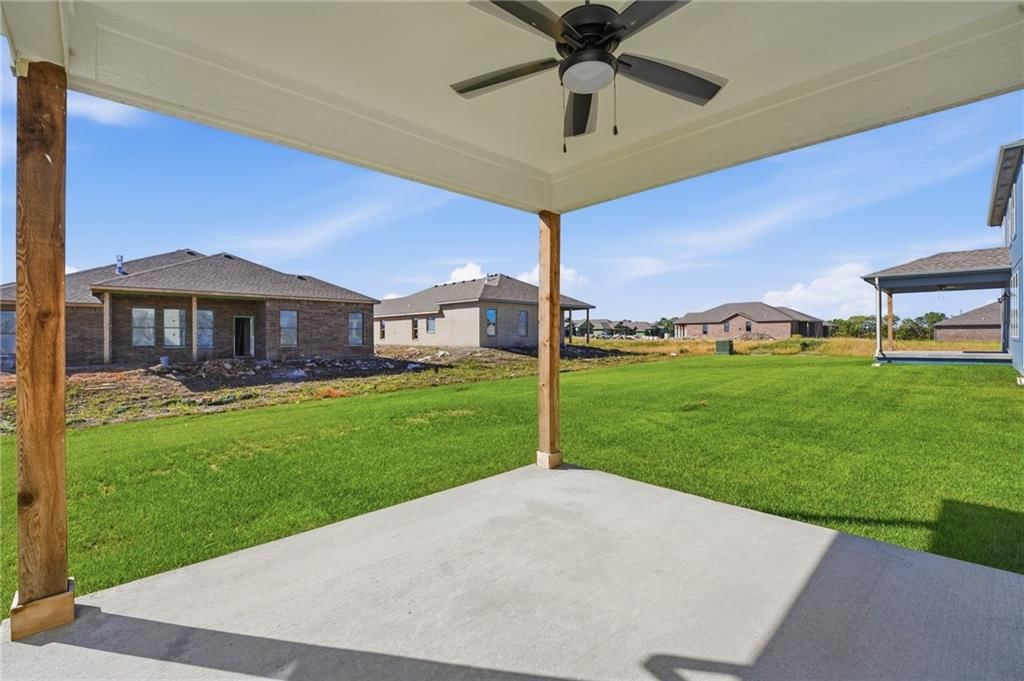
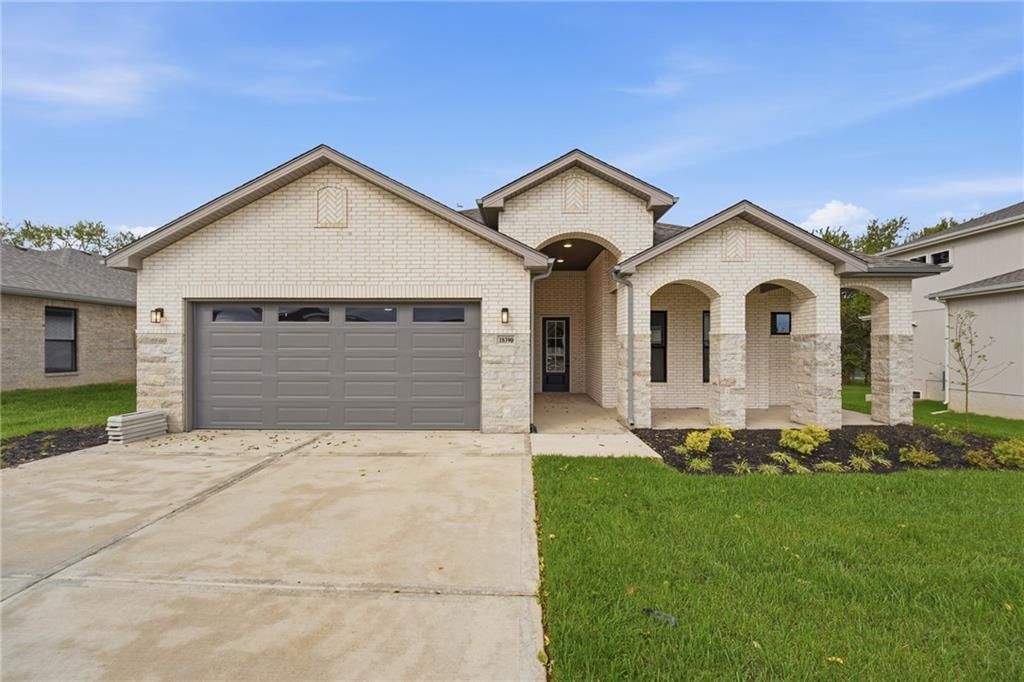
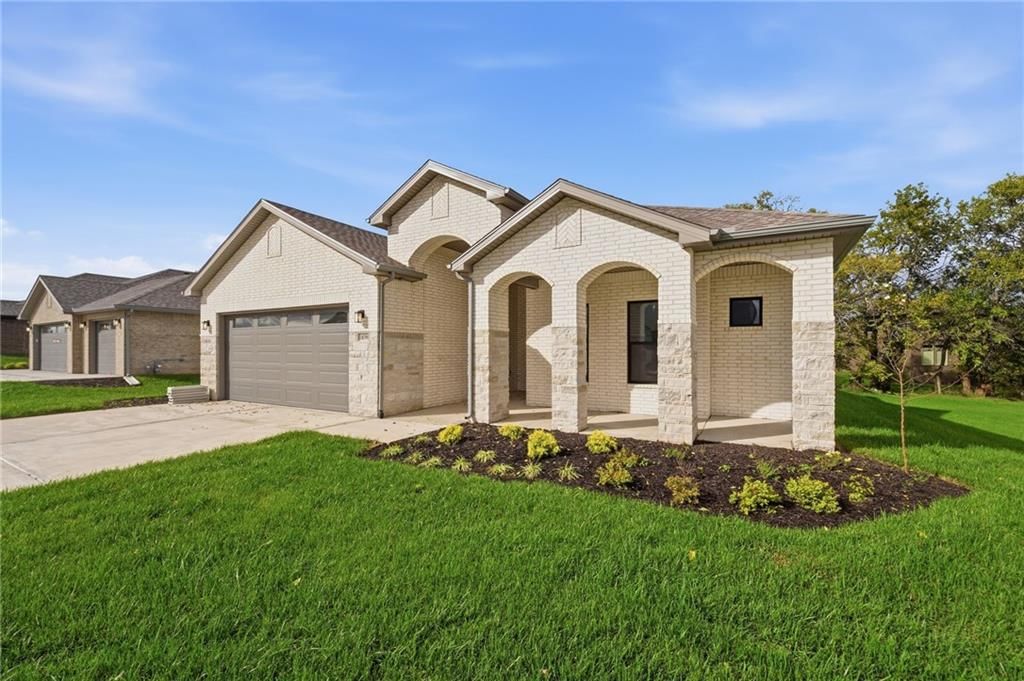
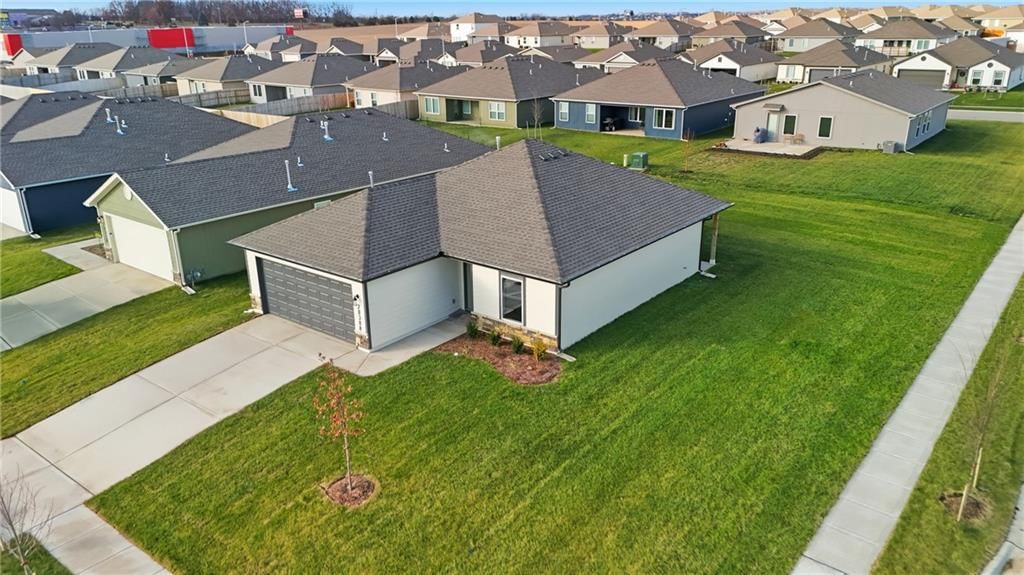
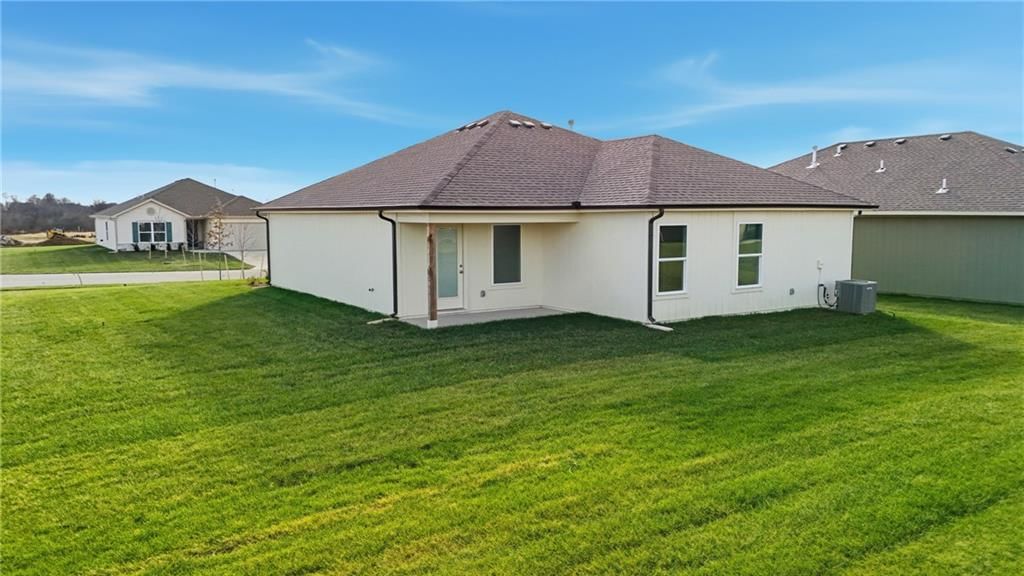
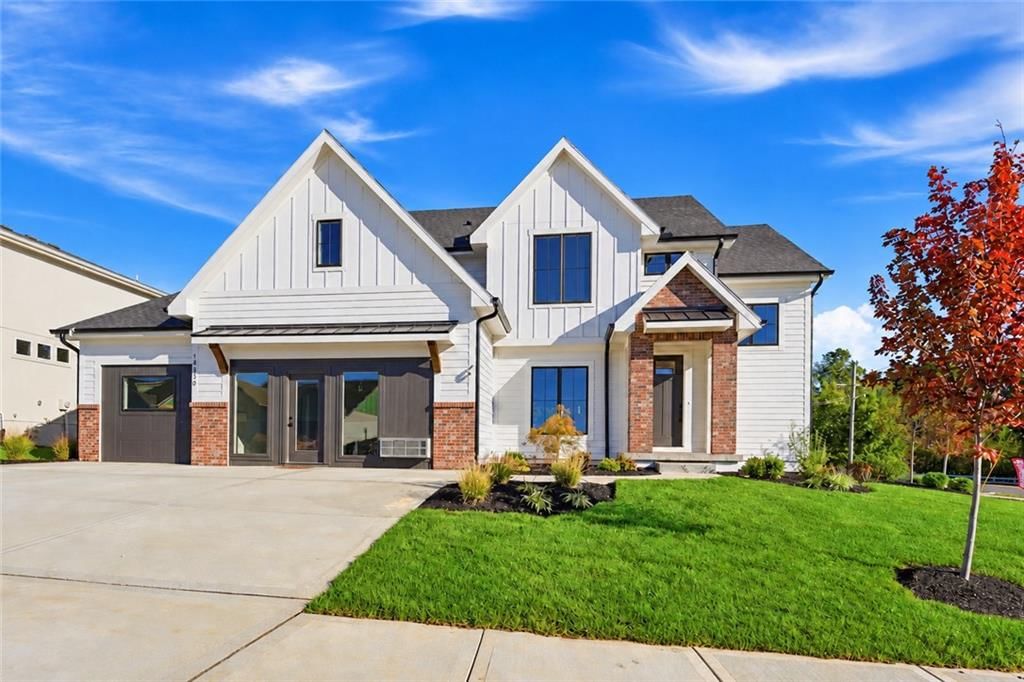
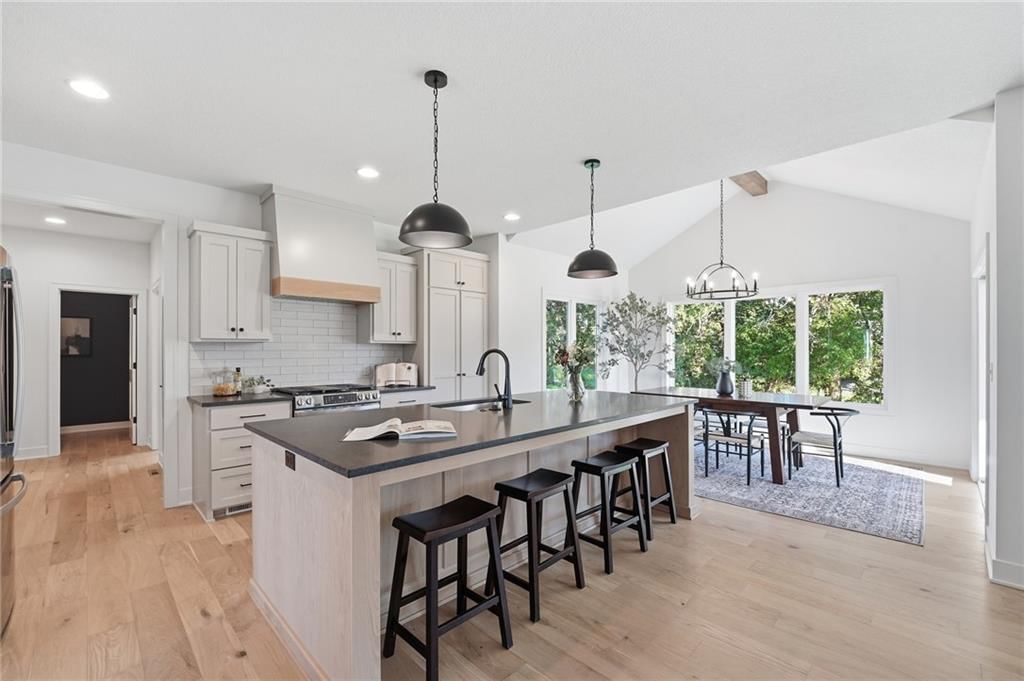
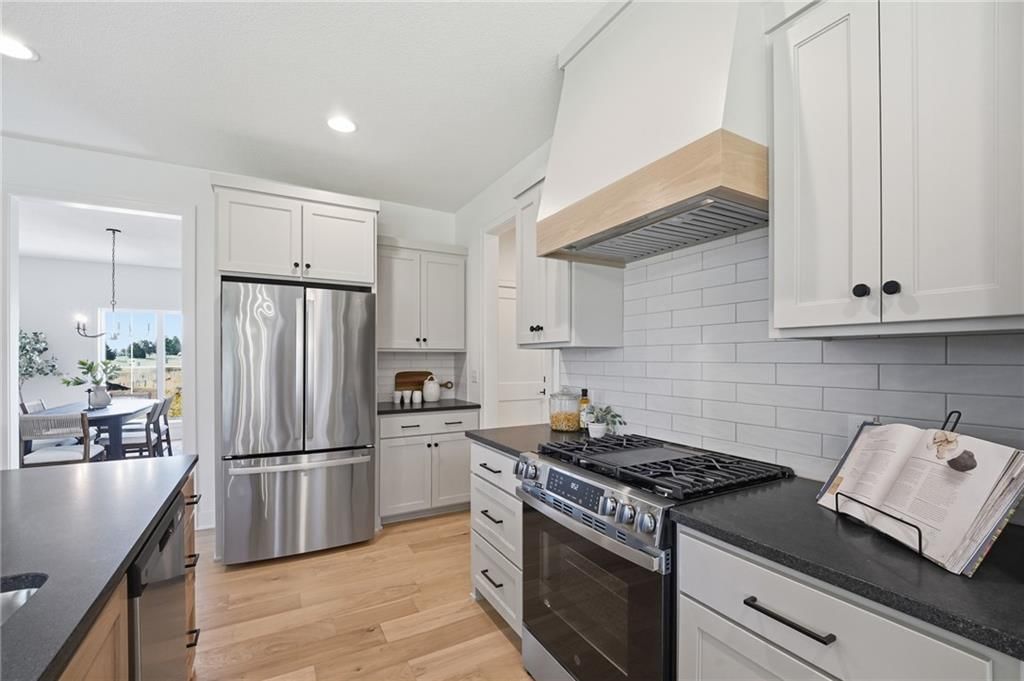
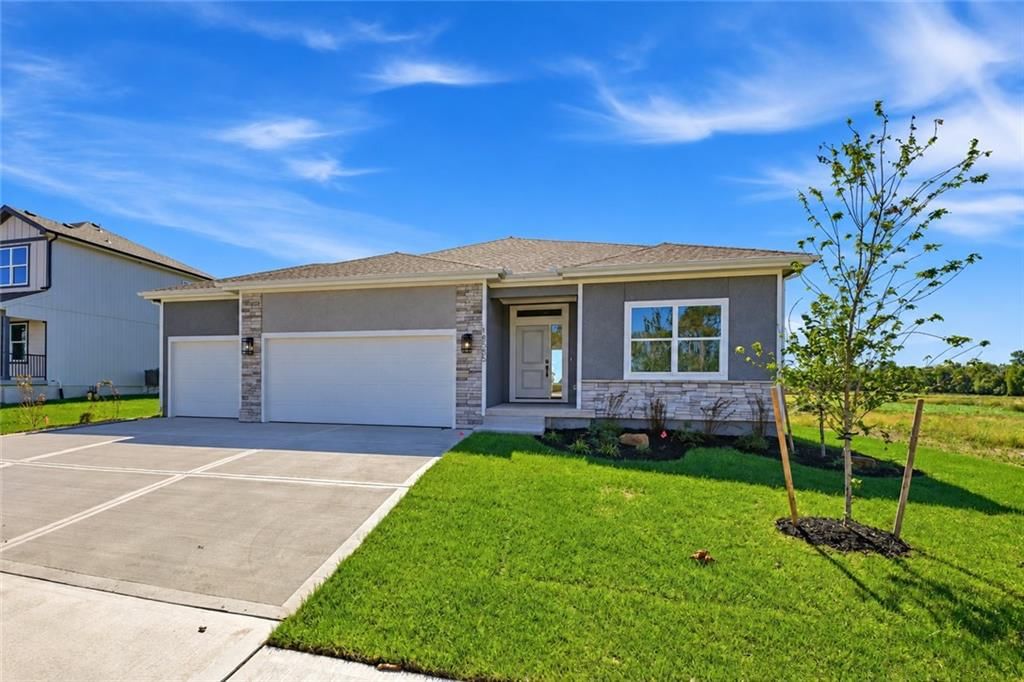
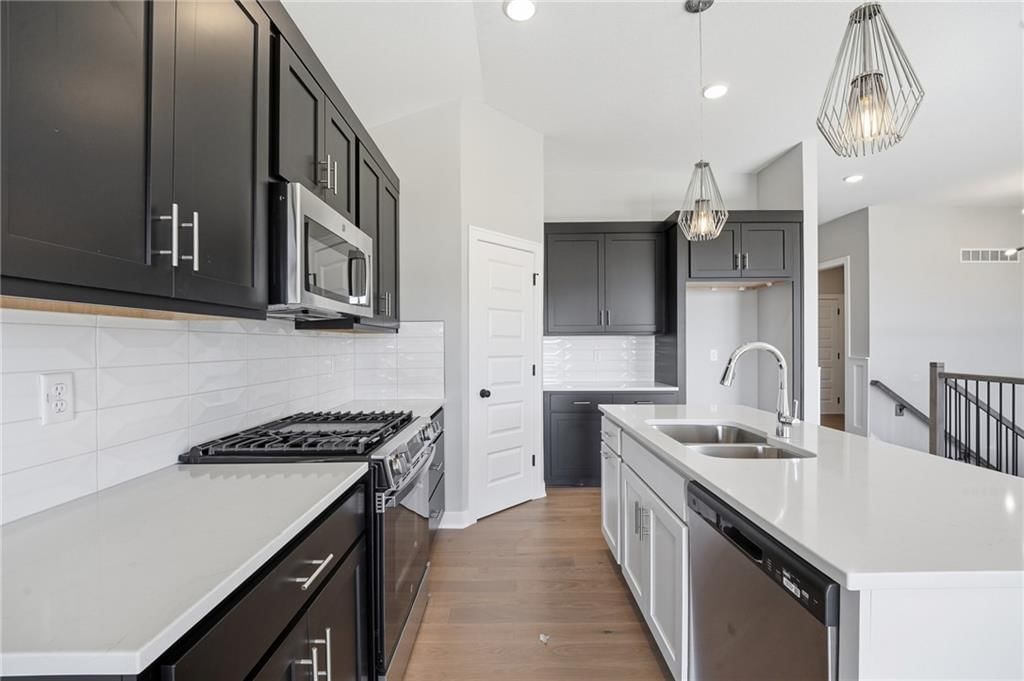
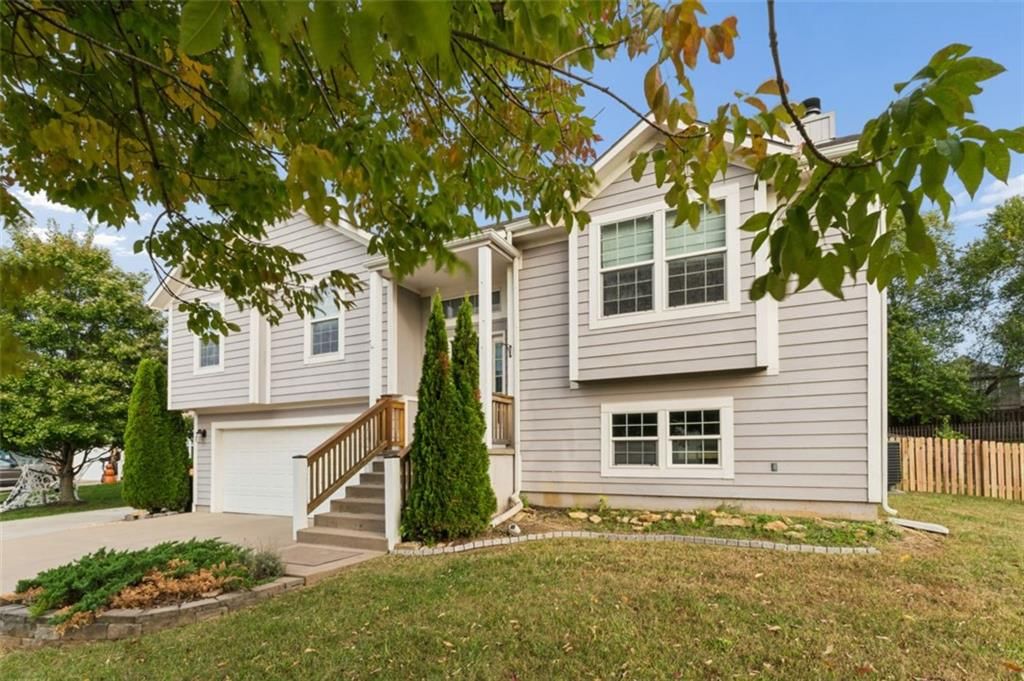
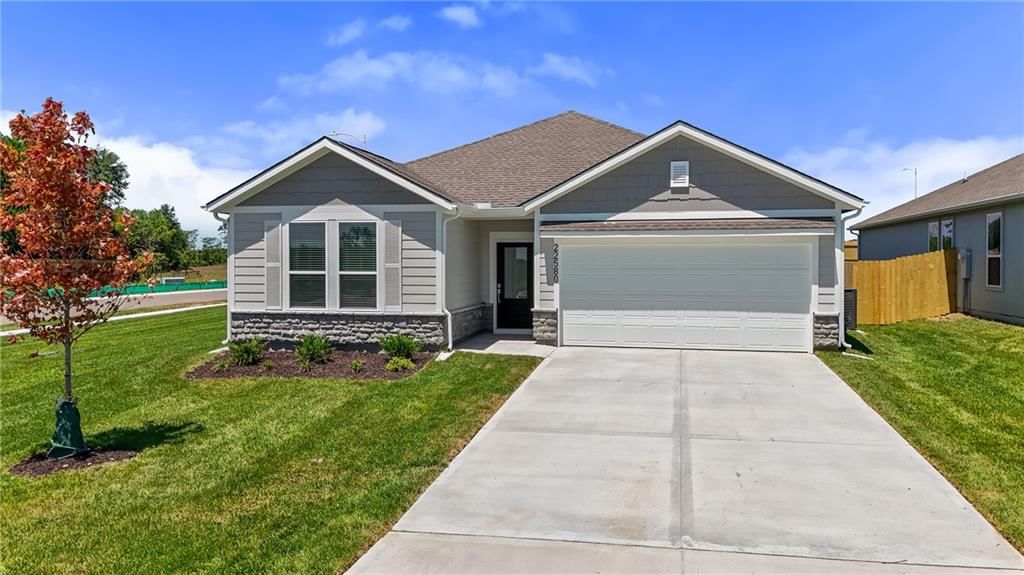
Spring Hill, KS has 156 homes for sale right now, 1 of them coming soon, with a median list price of $447,990. These homes were built between 1890 and 2026. They range from 100 to 3,737 square feet.
Housing market trends in Spring Hill, Kansas
As of Oct 22, 2026, Spring Hill, KS: 156 homes for sale · 20 new in the last 7 days · median asking $447,990 · 55 price reductions · a median of 27 days to contract. 42 homes closed in the last 30 days, at a median of $403,990. At the pace of the last 90 days that is 3.55 months of supply. Inventory is up 3.4% from four weeks ago.
| Measure | Sep 2026 | Aug 2026 | Sep 2025 |
|---|---|---|---|
| Median sale price | $374,990 | $394,990 | $403,641 |
| Median price per sq ft | $227 | $210 | $213 |
| Median days to contract | 14 | 45 | 19 |
| Sell-to-list ratio | 100% | 100% | 100% |
| Homes sold | 29 | 53 | 27 |
| New listings | 62 | 68 | 33 |
| Went under contract | 39 | 50 | 34 |
Schools serving Spring Hill
| School | Median list | For sale |
|---|---|---|
| School districts | ||
| Spring Hill School District | Median$448,199 | 154 |
| High schools | ||
| Spring Hill | Median$477,490 | 126 |
| Middle schools | ||
| Forest Spring | Median$539,975 | 74 |
| Spring Hill | Median$396,490 | 52 |
| Elementary schools | ||
| Wolf Creek | Median$570,000 | 53 |
| Dayton Creek | Median$419,990 | 38 |
| Spring Hill | Median$380,990 | 35 |
How we compute these
- Median list.
- The middle asking price among the homes for sale right now. Half are listed above it, half below.
- For sale.
- Homes listed as active right now. A live count, not a monthly average.
Popular home searches in Spring Hill
| Search | For sale |
|---|---|
| Open houses | For sale27 |
| Luxury homes | For sale9 |
| Just listed homes | For sale20 |
| Price-reduced homes | For sale55 |
| Coming soon homes | For sale1 |
| Homes under contract | For sale70 |
How we compute these
- For sale.
- Homes listed as active right now. A live count, not a monthly average.
Homes by price in Spring Hill
| Price range | For sale |
|---|---|
| Under $300,000 | For sale11 |
| Under $400,000 | For sale55 |
| Under $500,000 | For sale93 |
| Under $600,000 | For sale125 |
How we compute these
- For sale.
- Homes listed as active right now. A live count, not a monthly average.
Homes by feature in Spring Hill
| Feature | For sale |
|---|---|
| Homes with 2+ full bathrooms | For sale136 |
| 2-car garage homes | For sale133 |
| Homes with an attached garage | For sale125 |
| HOA under $300/mo | For sale106 |
How we compute these
- For sale.
- Homes listed as active right now. A live count, not a monthly average.
Search by property type in Spring Hill
| Property type | Market (Market type is set by months of supply — how long it would take to sell every home for sale at the current pace. Under ~4 months favors sellers (low inventory, faster sales, homes near or above asking); over ~6 favors buyers (more choice, more negotiating room). 4–6 is balanced.) | Months supply | For sale | Median sale | Sell-to-list | Days to contract | Coming soon | Under contract |
|---|---|---|---|---|---|---|---|---|
| Single Family | Seller's | 3.9 mo | 134 | Median$400,558 | 98% | 20d | 1 | 68 |
| Townhouse | — | — | — | Median— | — | — | — | — |
| Half Duplex | — | — | — | Median— | — | — | — | — |
| Lots / Land | Strong Buyer's | 14 mo | 14 | Median$275,000 | 97% | 44d | 0 | 1 |
How we compute these
- Market.
- Market type is set by months of supply — how long it would take to sell every home for sale at the current pace. Under ~4 months favors sellers (low inventory, faster sales, homes near or above asking); over ~6 favors buyers (more choice, more negotiating room). 4–6 is balanced.
- Months supply.
- How many months it would take to sell every home now for sale at the pace of the last 90 days: homes for sale ÷ (closings in the last 90 days ÷ 3).
- For sale.
- Homes listed as active right now. A live count, not a monthly average.
- Days to contract.
- The middle number of days between a home being listed and going under contract, over the last 90 days of closings. It is not days-to-close, and it is not how long today's listings have been sitting. Newly built homes are excluded, because a build finishing is not a market moving.
- Coming soon.
- Homes announced but not yet accepting showings. A live count.
- Under contract.
- Homes with an accepted contract that have not closed yet. A live count.
Nearby neighborhoods to Spring Hill
| Neighborhood | Market (Market type is set by months of supply — how long it would take to sell every home for sale at the current pace. Under ~4 months favors sellers (low inventory, faster sales, homes near or above asking); over ~6 favors buyers (more choice, more negotiating room). 4–6 is balanced.) | Months supply | For sale | Median sale | Sell-to-list | Days to contract | Coming soon | Under contract |
|---|---|---|---|---|---|---|---|---|
| Wiswell Farms | Seller's | 2.2 mo | 11 | Median$334,990 | 100% | 24d | 0 | 6 |
| Dayton Creek | Balanced | 4.7 mo | 15 | Median$496,490 | 99% | 28d | 0 | 2 |
| Foxwood Ranch | Strong Seller's ▲ | 1.3 mo | 2 | Median$465,000 | 100% | 60d | 0 | 0 |
| Boulder Springs | Seller's | 2.4 mo | 5 | Median$365,900 | 100% | 54d | 0 | 10 |
| Woodland Crossing | Balanced | 4.3 mo | 9 | Median$410,000 | 98% | 42d | 0 | 3 |
How we compute these
- Market.
- Market type is set by months of supply — how long it would take to sell every home for sale at the current pace. Under ~4 months favors sellers (low inventory, faster sales, homes near or above asking); over ~6 favors buyers (more choice, more negotiating room). 4–6 is balanced.
- Months supply.
- How many months it would take to sell every home now for sale at the pace of the last 90 days: homes for sale ÷ (closings in the last 90 days ÷ 3).
- For sale.
- Homes listed as active right now. A live count, not a monthly average.
- Days to contract.
- The middle number of days between a home being listed and going under contract, over the last 90 days of closings. It is not days-to-close, and it is not how long today's listings have been sitting. Newly built homes are excluded, because a build finishing is not a market moving.
- Coming soon.
- Homes announced but not yet accepting showings. A live count.
- Under contract.
- Homes with an accepted contract that have not closed yet. A live count.
Search homes nearby Spring Hill
| Place | Market (Market type is set by months of supply — how long it would take to sell every home for sale at the current pace. Under ~4 months favors sellers (low inventory, faster sales, homes near or above asking); over ~6 favors buyers (more choice, more negotiating room). 4–6 is balanced.) | Months supply | Median list | Sell-to-list | Days to contract | For sale | Coming soon | Under contract |
|---|---|---|---|---|---|---|---|---|
| Spring Hill | Balanced | 4.1 mo | Median$447,990 | 97% | 27d | 155 | 1 | 70 |
| Overland Park | Seller's | 2.4 mo | Median$743,925 | 102% | 16d | 489 | 51 | 329 |
| Olathe | Seller's | 3.1 mo | Median$625,490 | 100% | 18d | 533 | 32 | 293 |
| Shawnee | Seller's | 2.6 mo | Median$564,500 | 100% | 16d | 176 | 19 | 107 |
| Lenexa | Seller's | 2.9 mo | Median$645,150 | 99% | 21d | 185 | 11 | 85 |
How we compute these
- Market.
- Market type is set by months of supply — how long it would take to sell every home for sale at the current pace. Under ~4 months favors sellers (low inventory, faster sales, homes near or above asking); over ~6 favors buyers (more choice, more negotiating room). 4–6 is balanced.
- Months supply.
- How many months it would take to sell every home now for sale at the pace of the last 90 days: homes for sale ÷ (closings in the last 90 days ÷ 3).
- Median list.
- The middle asking price among the homes for sale right now. Half are listed above it, half below.
- Days to contract.
- The middle number of days between a home being listed and going under contract, over the last 90 days of closings. It is not days-to-close, and it is not how long today's listings have been sitting. Newly built homes are excluded, because a build finishing is not a market moving.
- For sale.
- Homes listed as active right now. A live count, not a monthly average.
- Coming soon.
- Homes announced but not yet accepting showings. A live count.
- Under contract.
- Homes with an accepted contract that have not closed yet. A live count.
Nearby ZIP codes
| Place | Market (Market type is set by months of supply — how long it would take to sell every home for sale at the current pace. Under ~4 months favors sellers (low inventory, faster sales, homes near or above asking); over ~6 favors buyers (more choice, more negotiating room). 4–6 is balanced.) | Months supply | Median list | Sell-to-list | Days to contract | For sale | Coming soon | Under contract |
|---|---|---|---|---|---|---|---|---|
| 66083 | Balanced | 4.1 mo | Median$443,495 | 97% | 28d | 154 | 1 | 69 |
How we compute these
- Market.
- Market type is set by months of supply — how long it would take to sell every home for sale at the current pace. Under ~4 months favors sellers (low inventory, faster sales, homes near or above asking); over ~6 favors buyers (more choice, more negotiating room). 4–6 is balanced.
- Months supply.
- How many months it would take to sell every home now for sale at the pace of the last 90 days: homes for sale ÷ (closings in the last 90 days ÷ 3).
- Median list.
- The middle asking price among the homes for sale right now. Half are listed above it, half below.
- Days to contract.
- The middle number of days between a home being listed and going under contract, over the last 90 days of closings. It is not days-to-close, and it is not how long today's listings have been sitting. Newly built homes are excluded, because a build finishing is not a market moving.
- For sale.
- Homes listed as active right now. A live count, not a monthly average.
- Coming soon.
- Homes announced but not yet accepting showings. A live count.
- Under contract.
- Homes with an accepted contract that have not closed yet. A live count.