
9931 Woodson Drive, Overland Park, KS 66207, photo 10
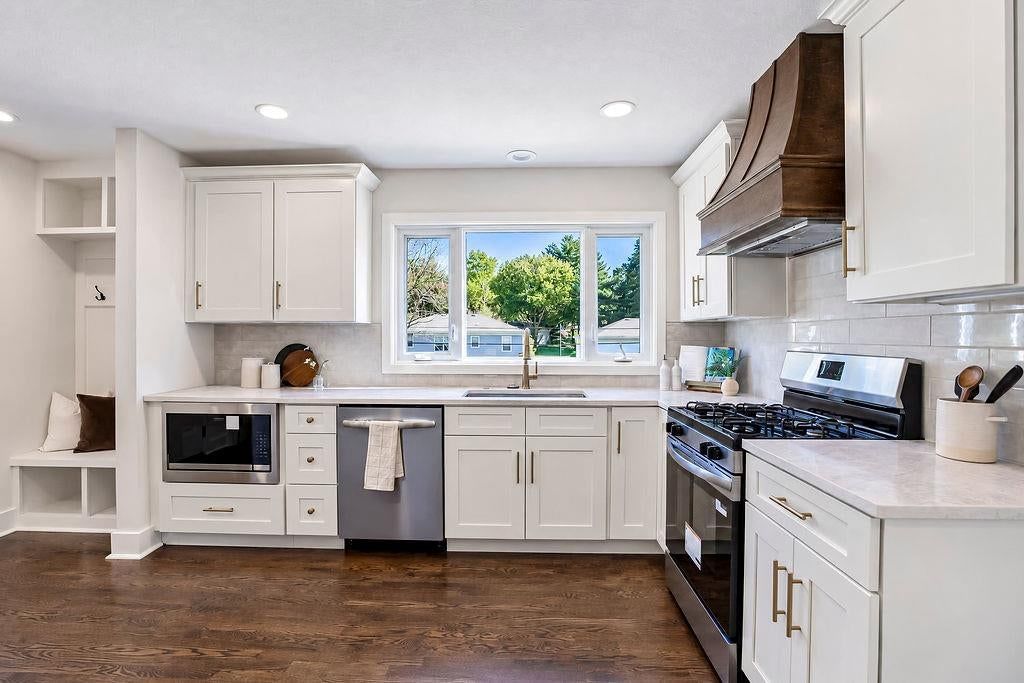 Photo 10
White kitchen cabinets, seen in photo 10
List price $599,950 · 3 beds · 2,619 sqft
9 homes for sale in Nall Hills · Sorted by Newest Listed
Nall Hills, Overland Park has 9 homes for sale right now, with a median list price of $425,000. These homes were built between 1958 and 1973. They range from 1,320 to 2,619 square feet.
As of Oct 24, 2026, Nall Hills, Overland Park: 9 homes for sale · 2 new in the last 7 days · median asking $425,000 · 3 price reductions. 2 homes closed in the last 30 days.
| Measure | Oct 2025–Sep 2026 | Sep 2025–Aug 2026 | Oct 2024–Sep 2025 |
|---|---|---|---|
| Median sale price | $425,000 | $425,000 | $430,000 |
| Median price per sq ft | $227 | $224 | $214 |
| Median days to contract | 14 | 13 | 12 |
| Sell-to-list ratio | 100% | 100% | 101% |
| Homes sold | 46 | 47 | 39 |
| New listings | 48 | 47 | 43 |
| Went under contract | 47 | 48 | 36 |
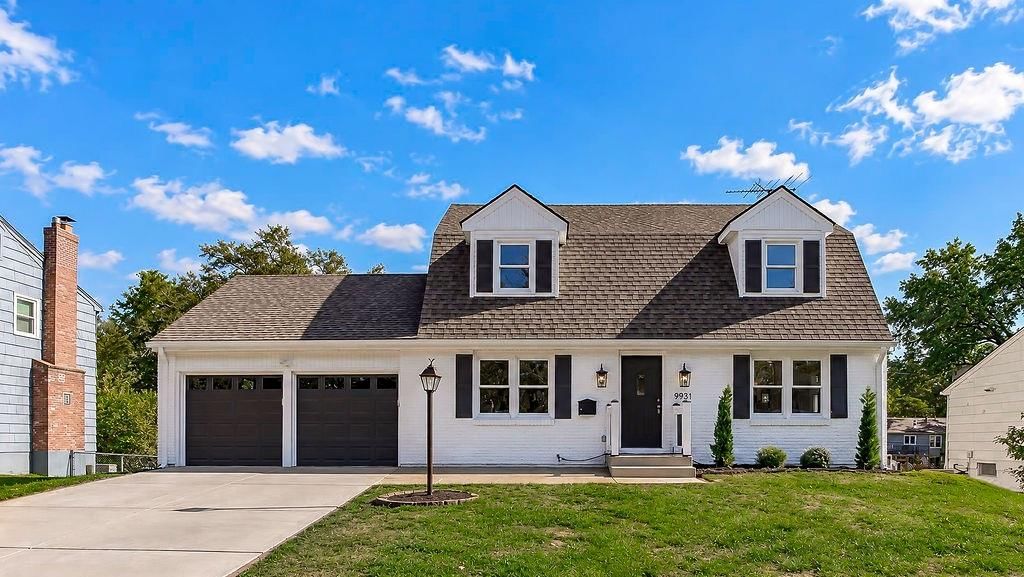
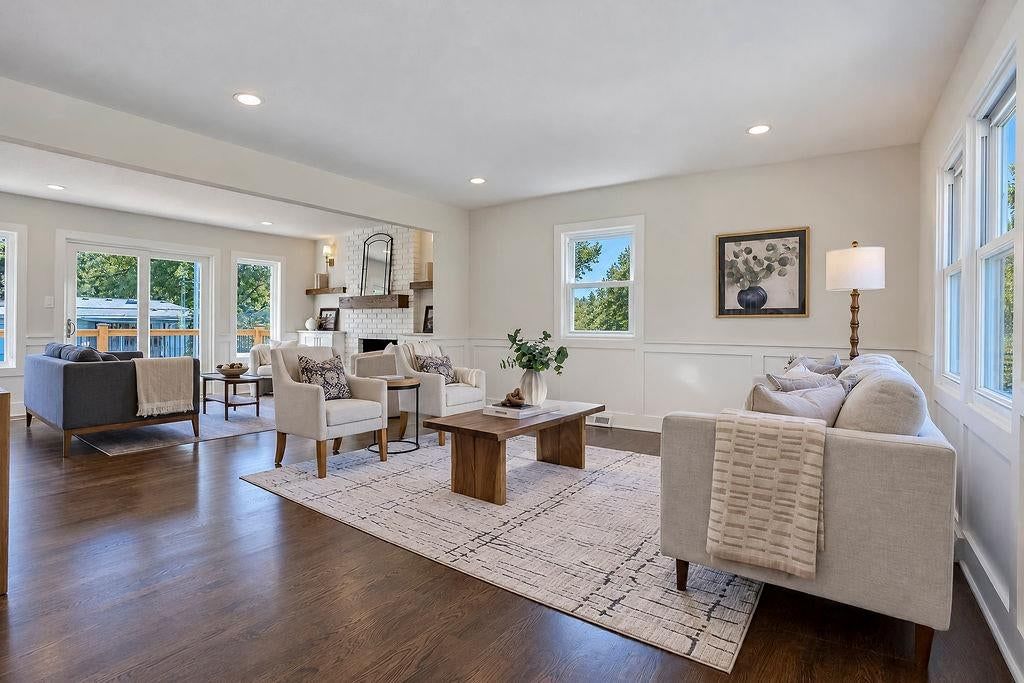
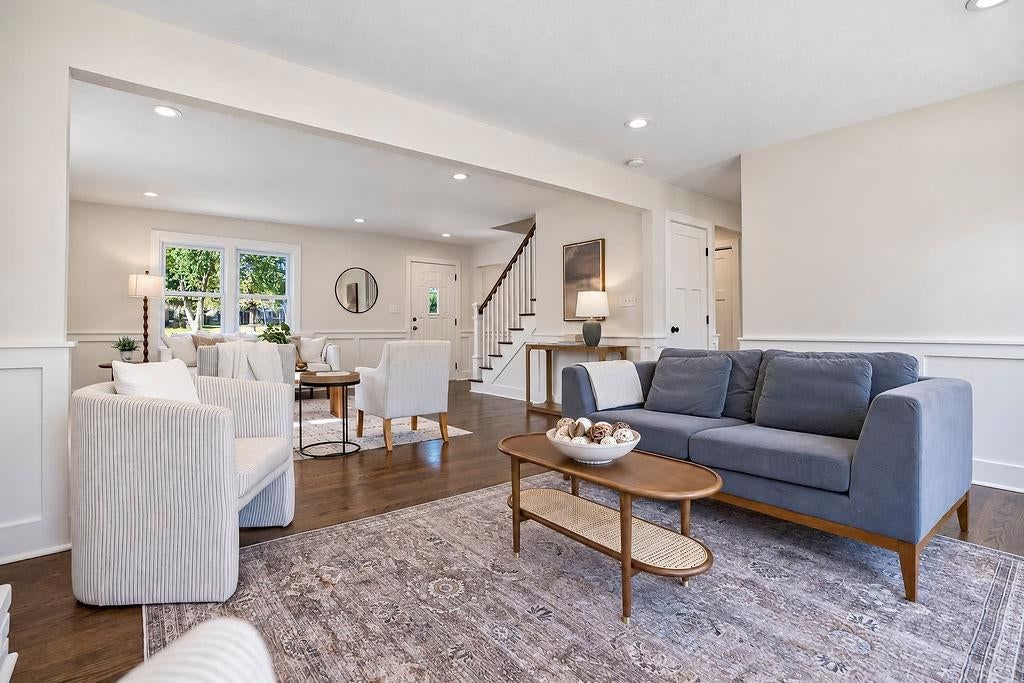
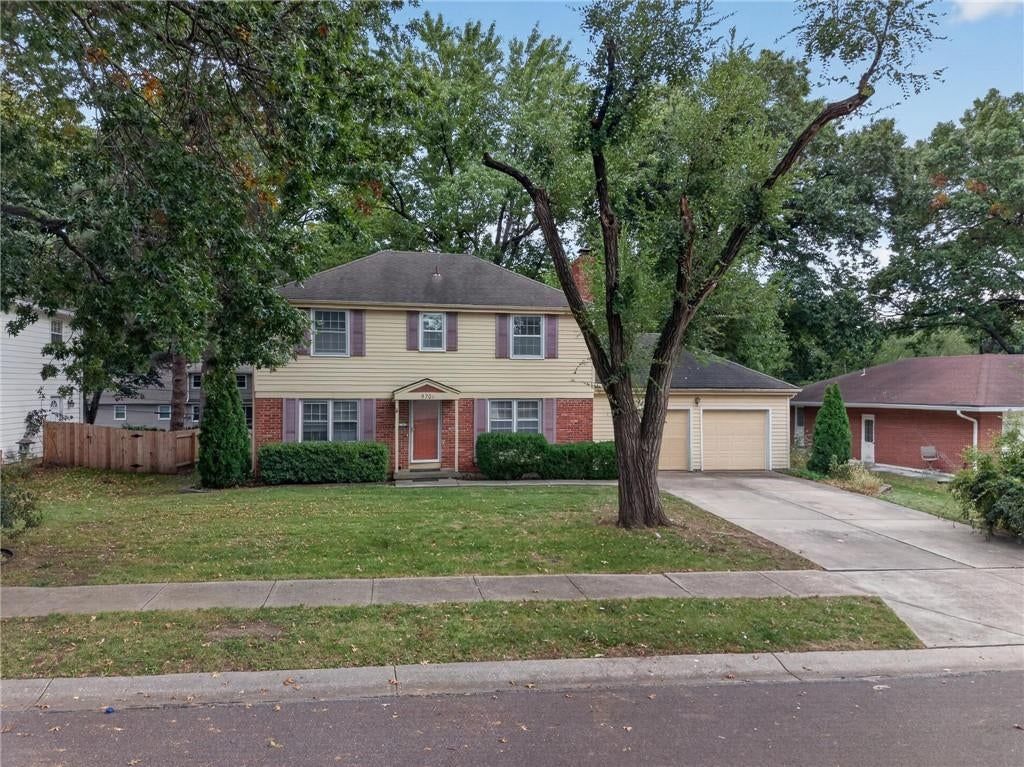
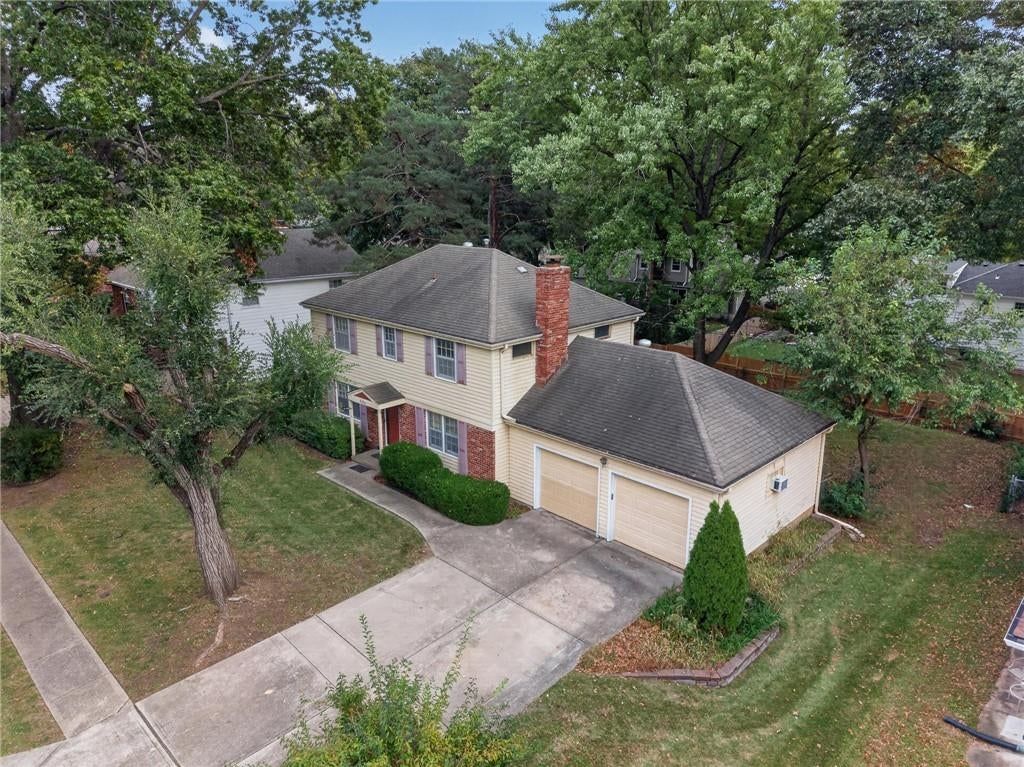
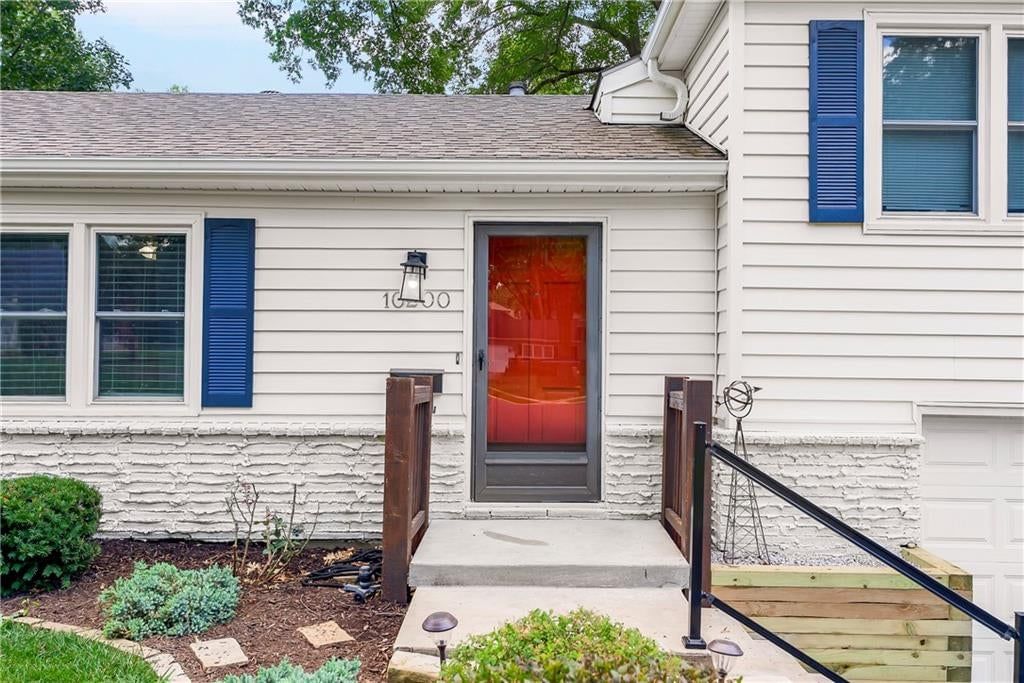
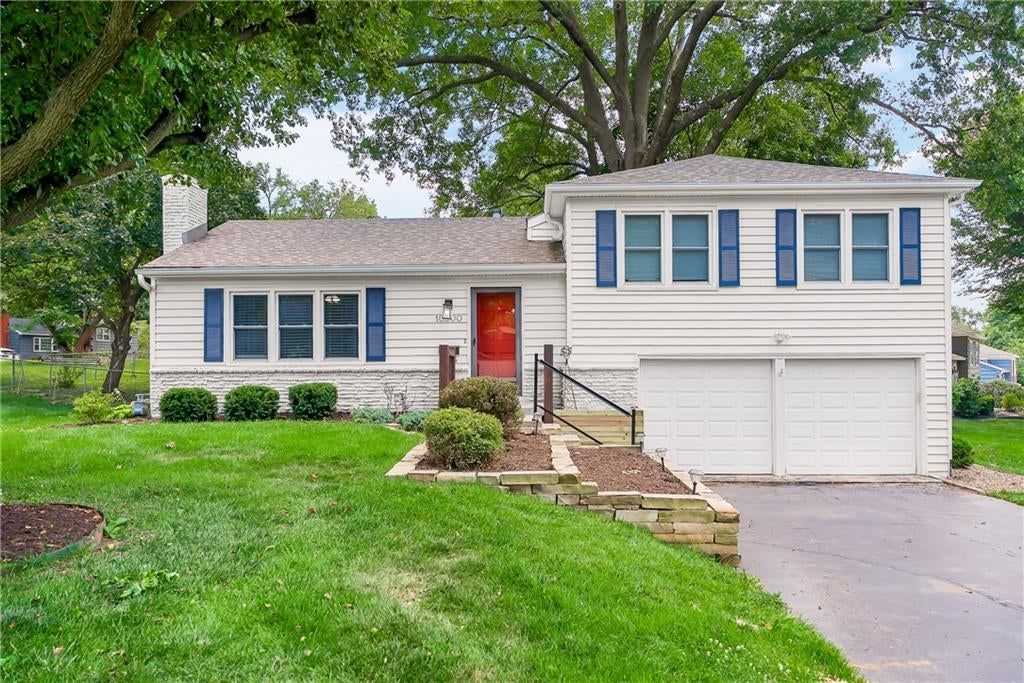
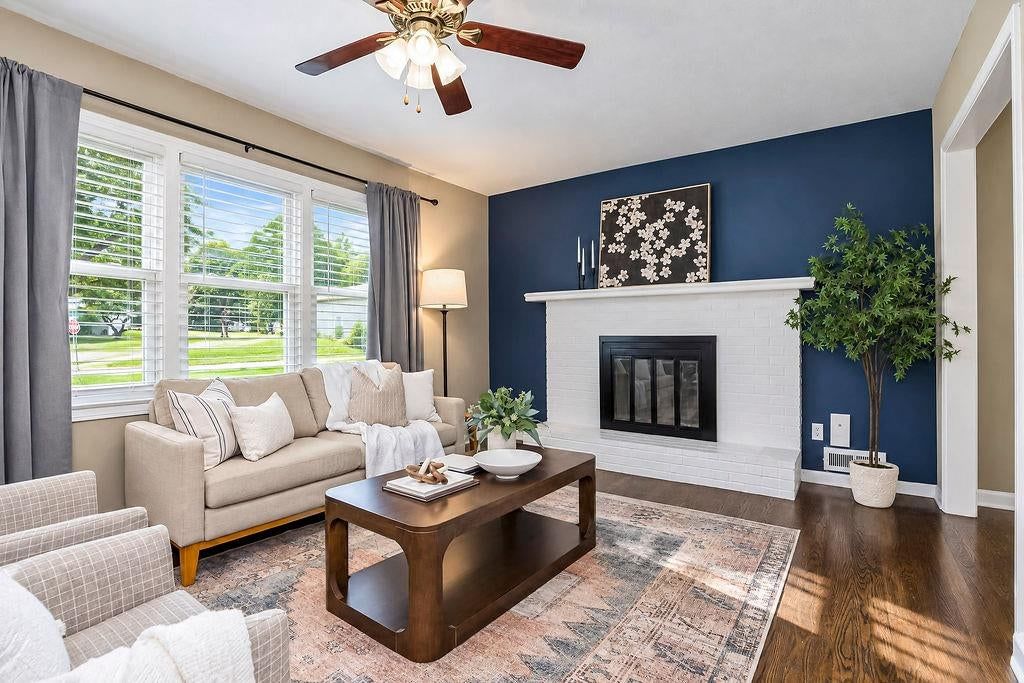
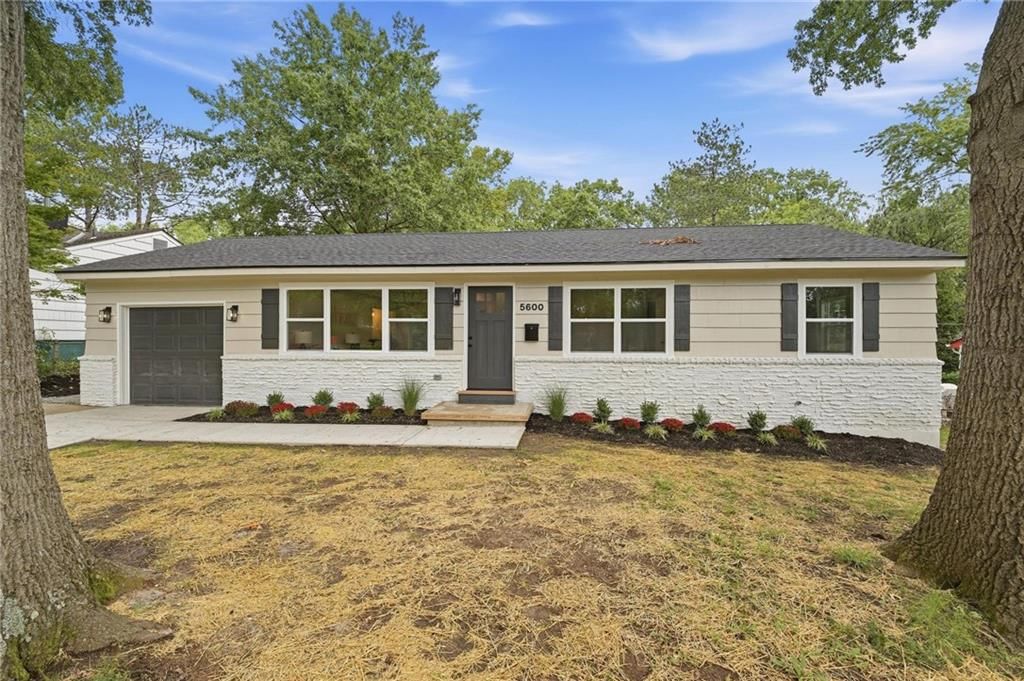
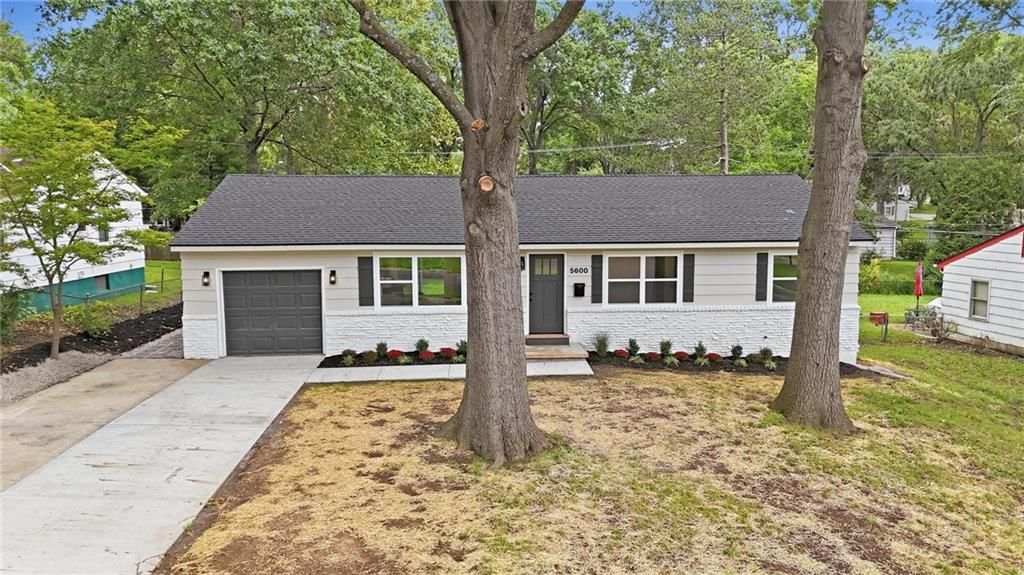
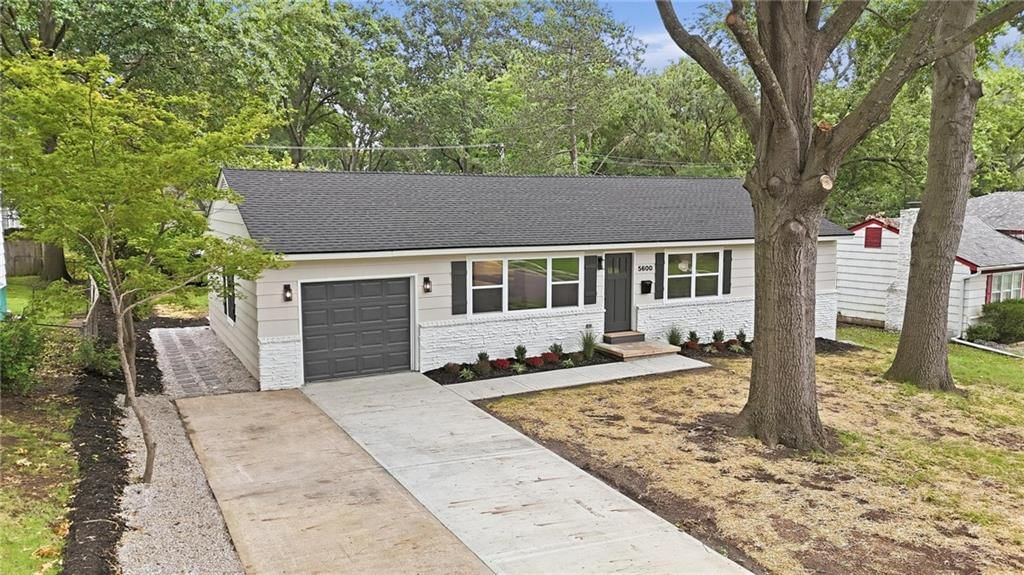
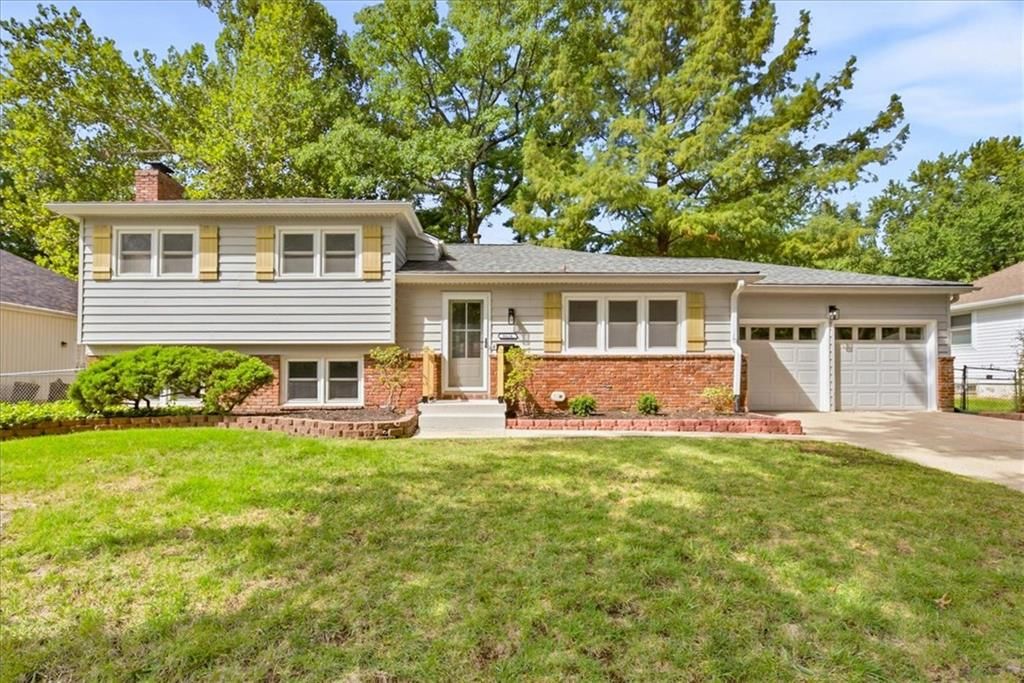
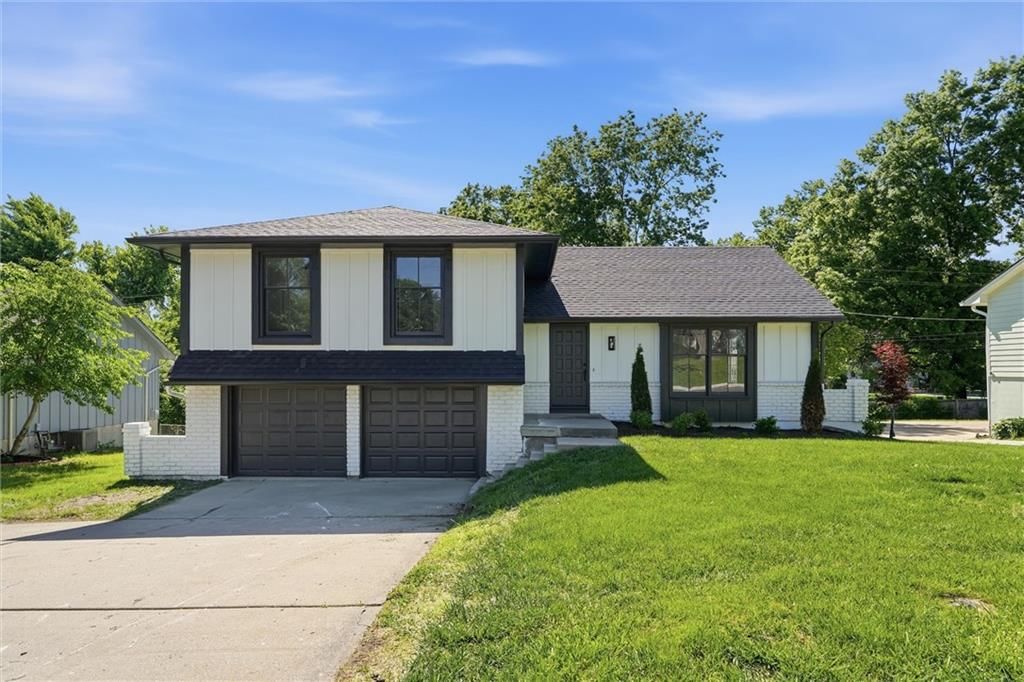
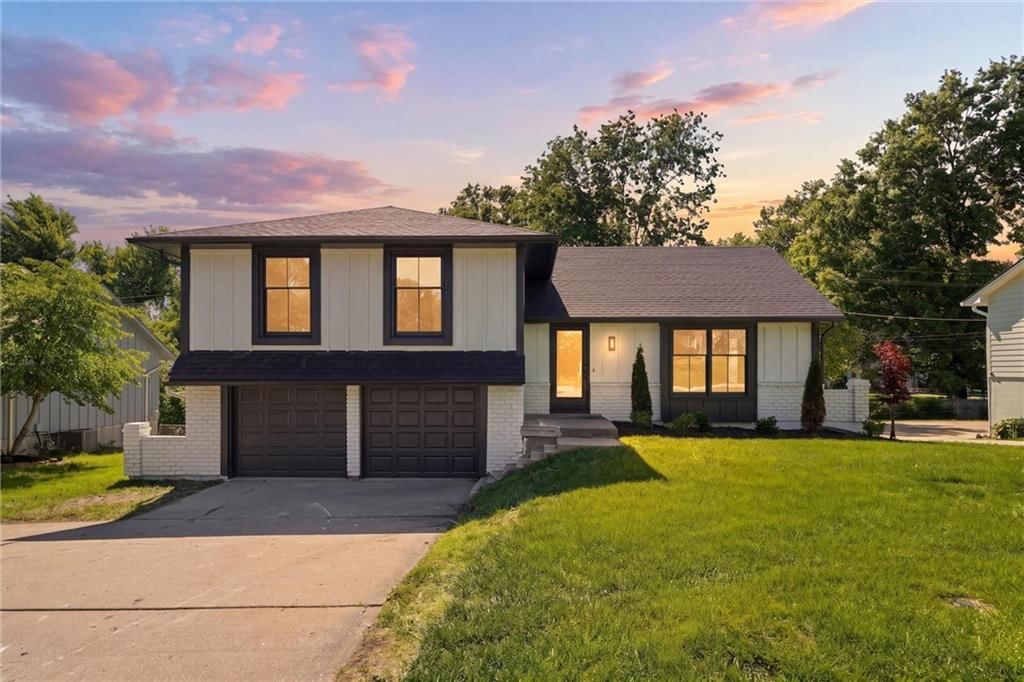
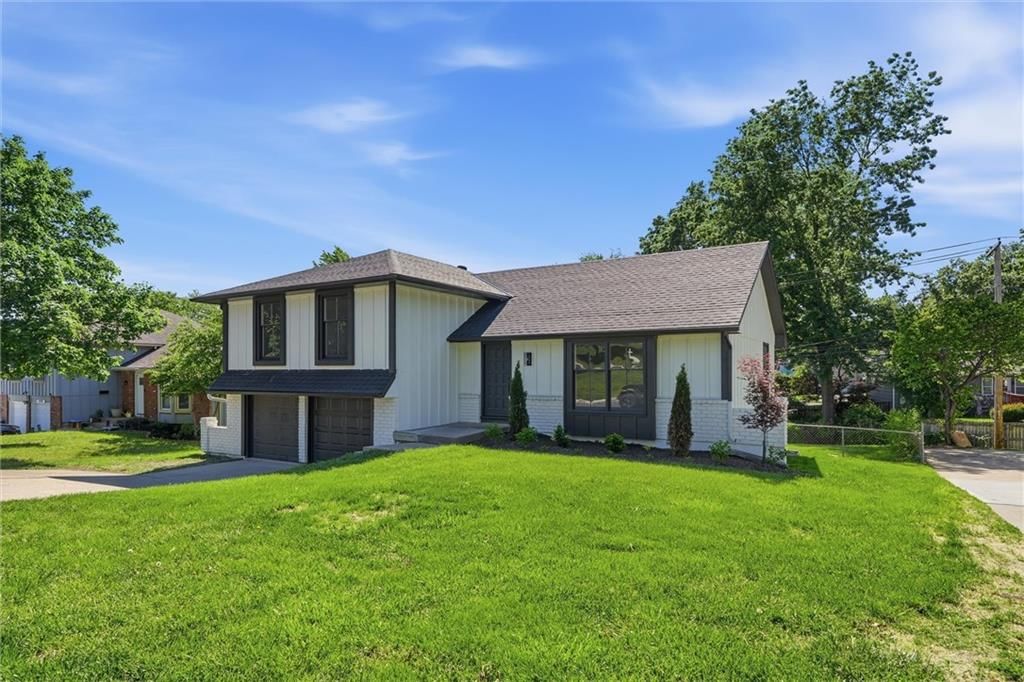
As of Oct 24, 2026
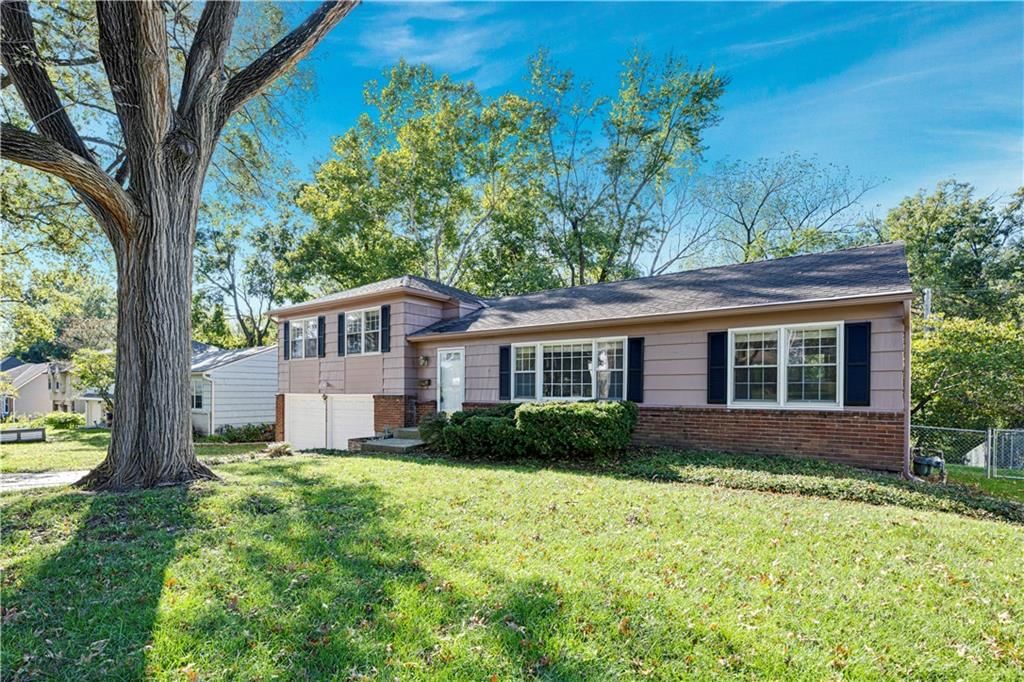
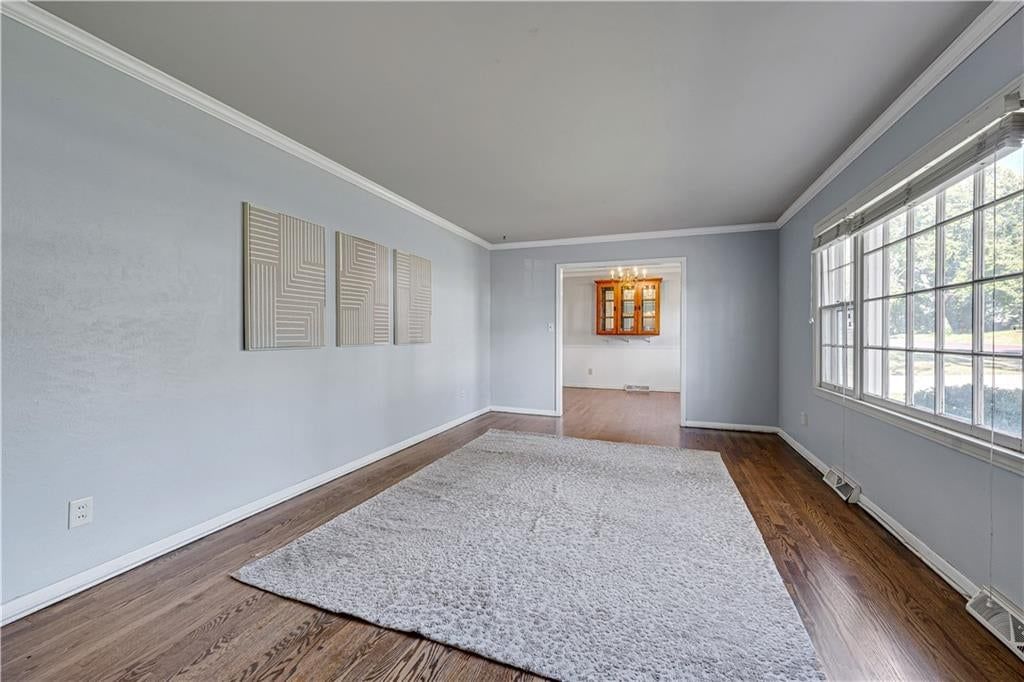
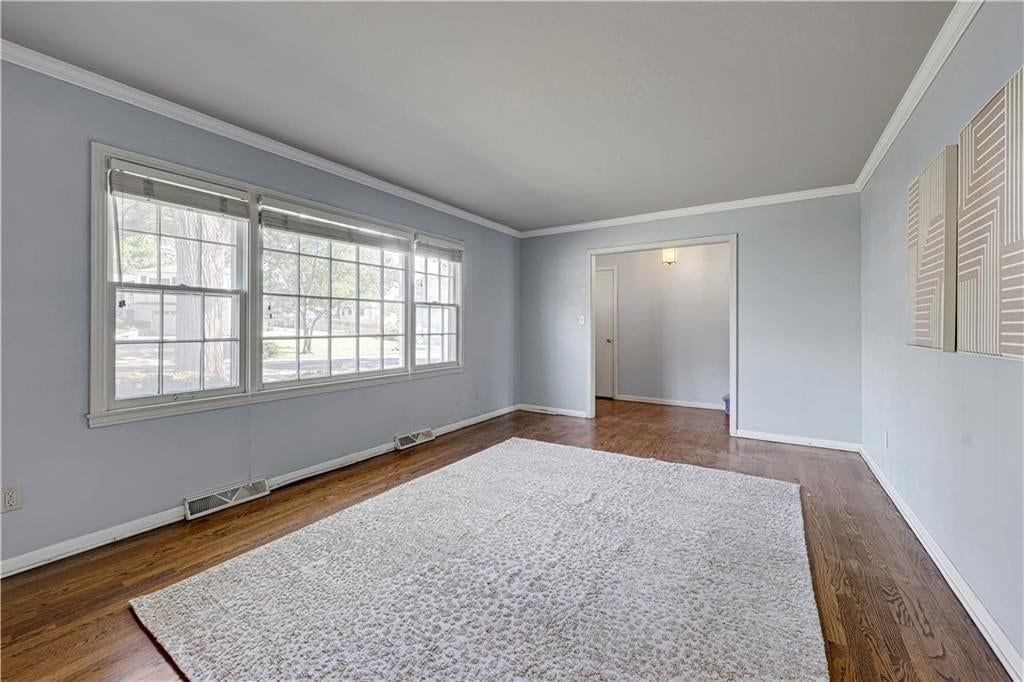
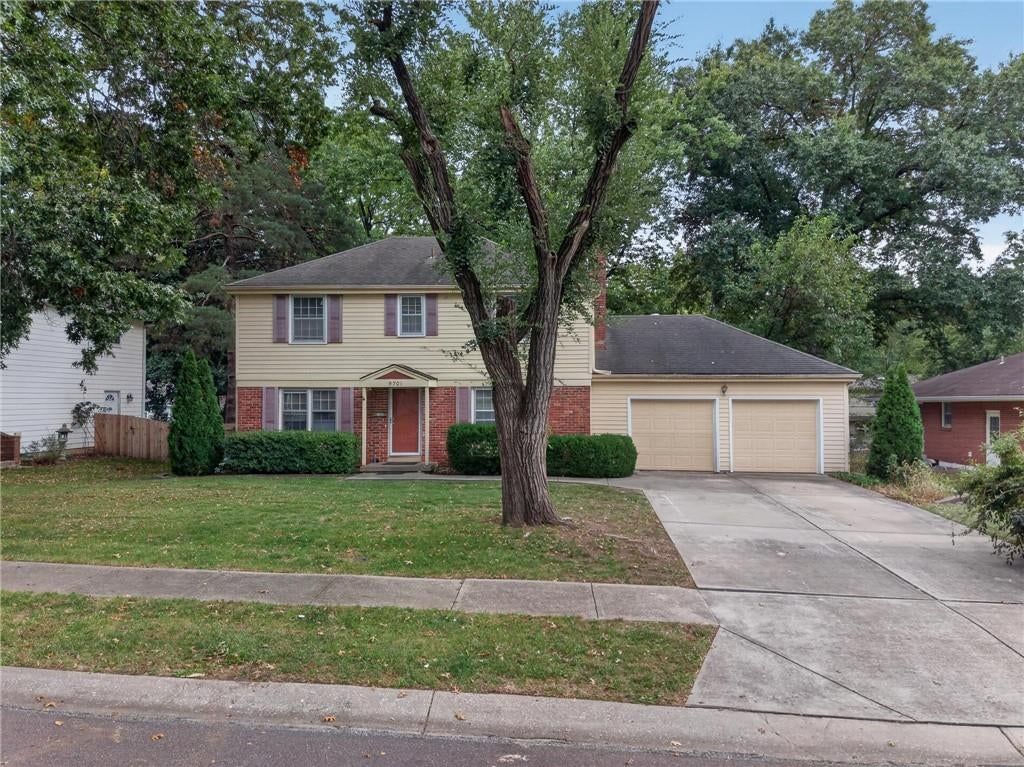
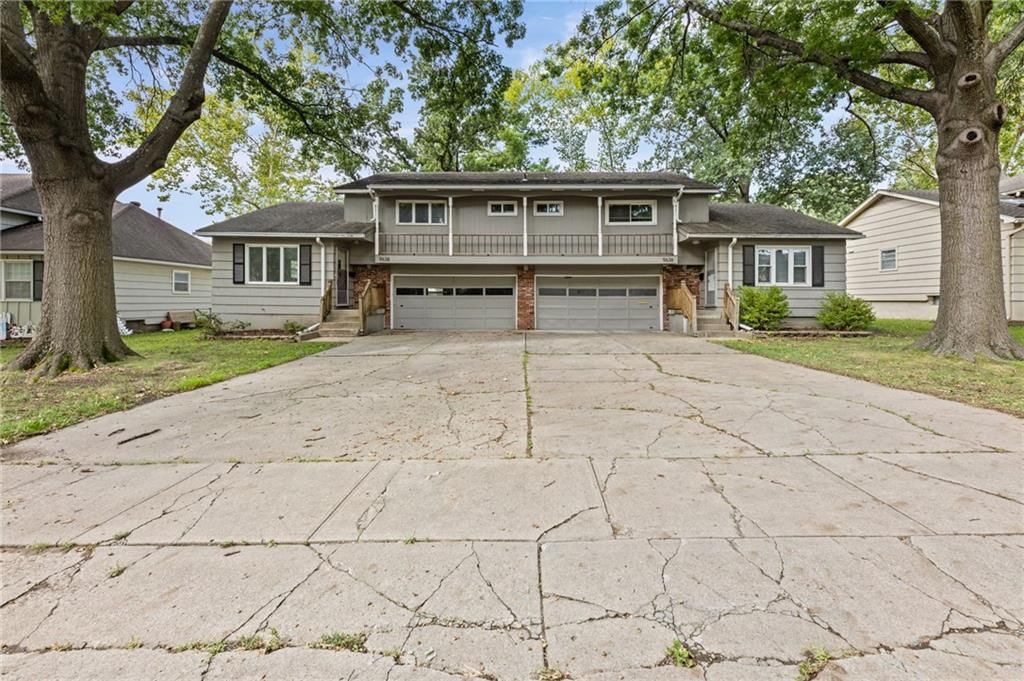
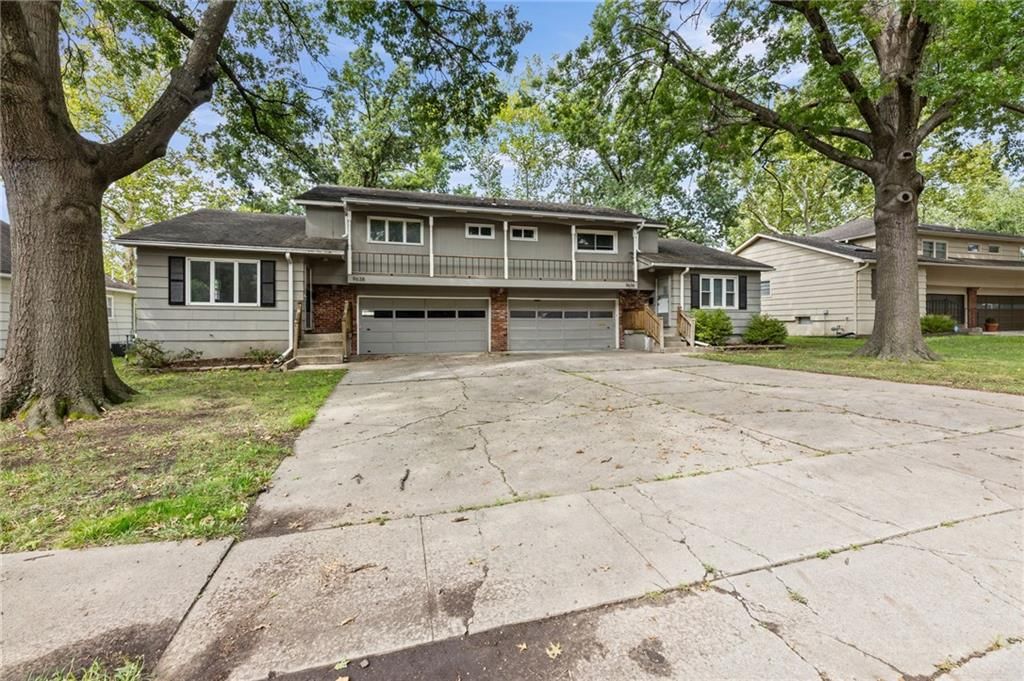
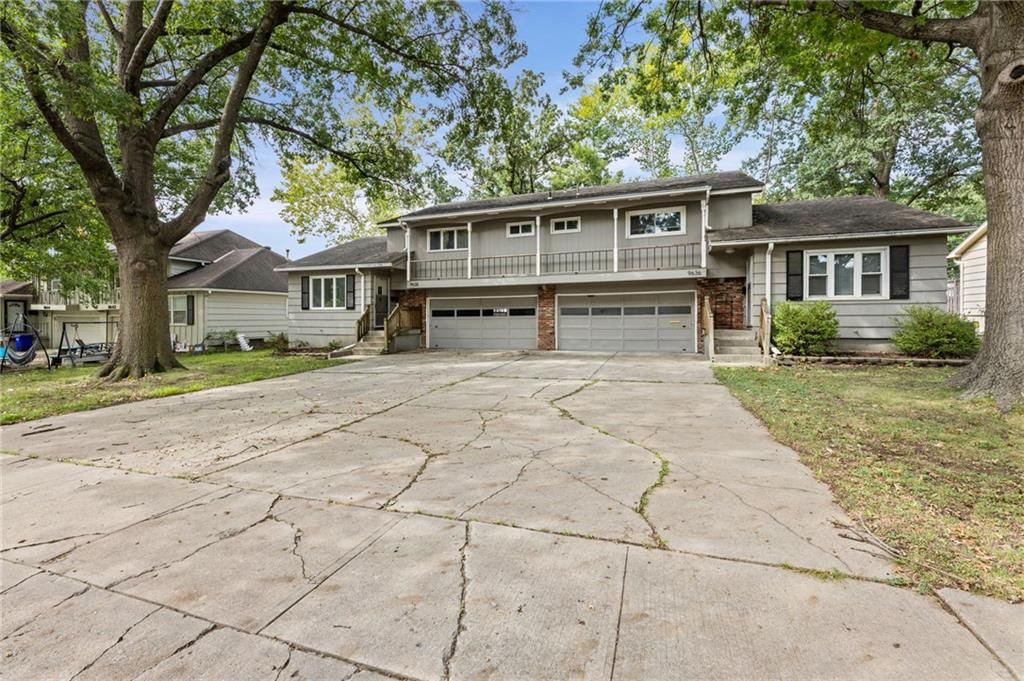
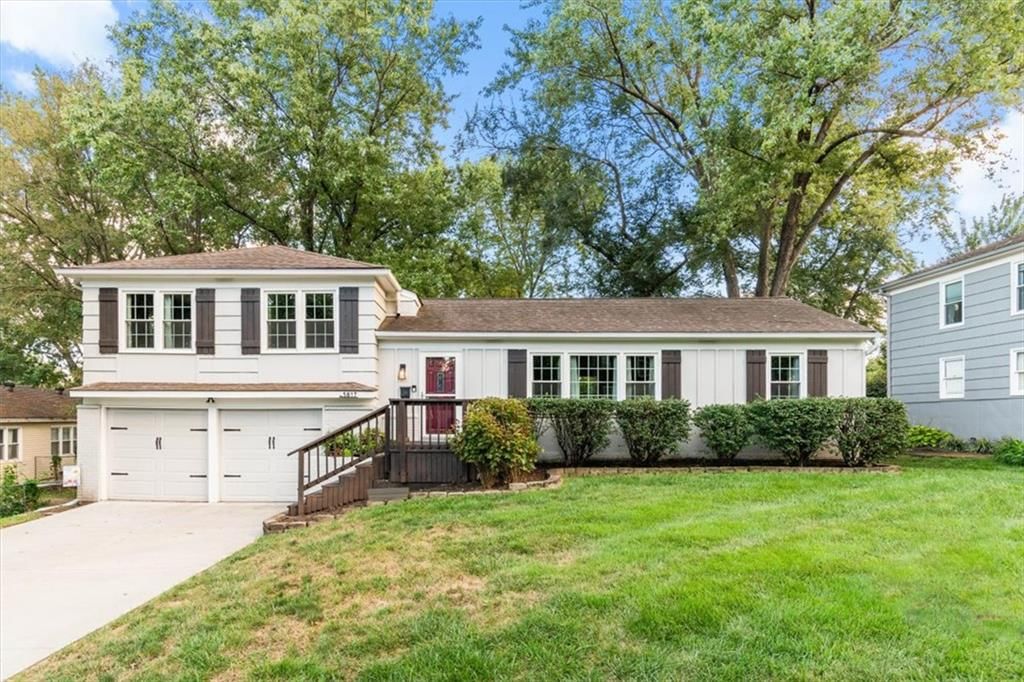
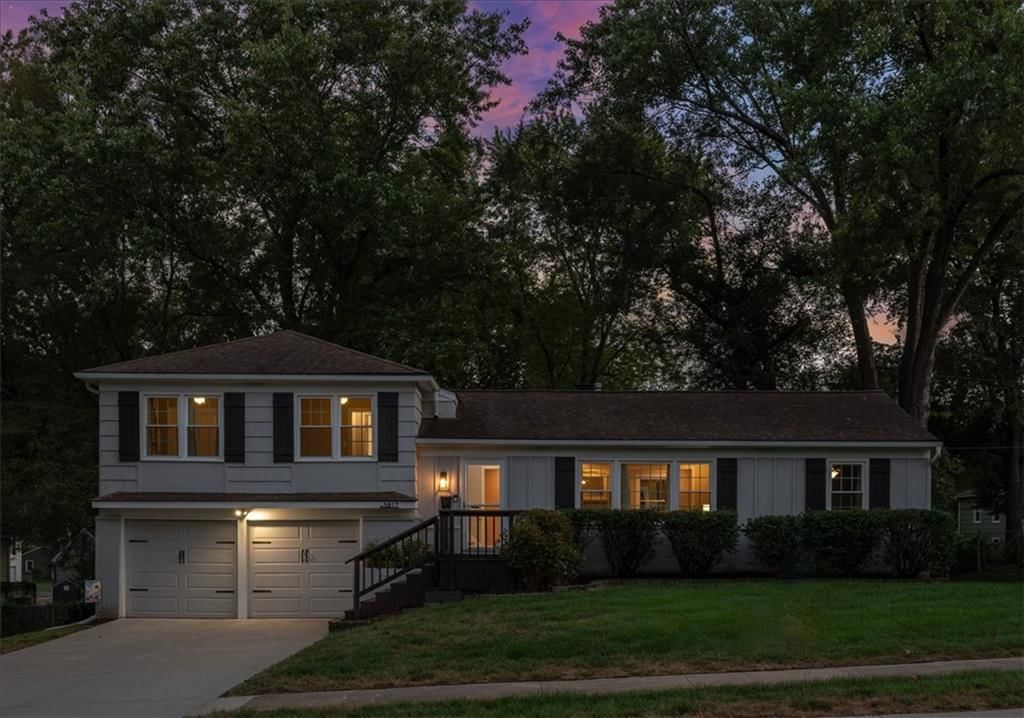
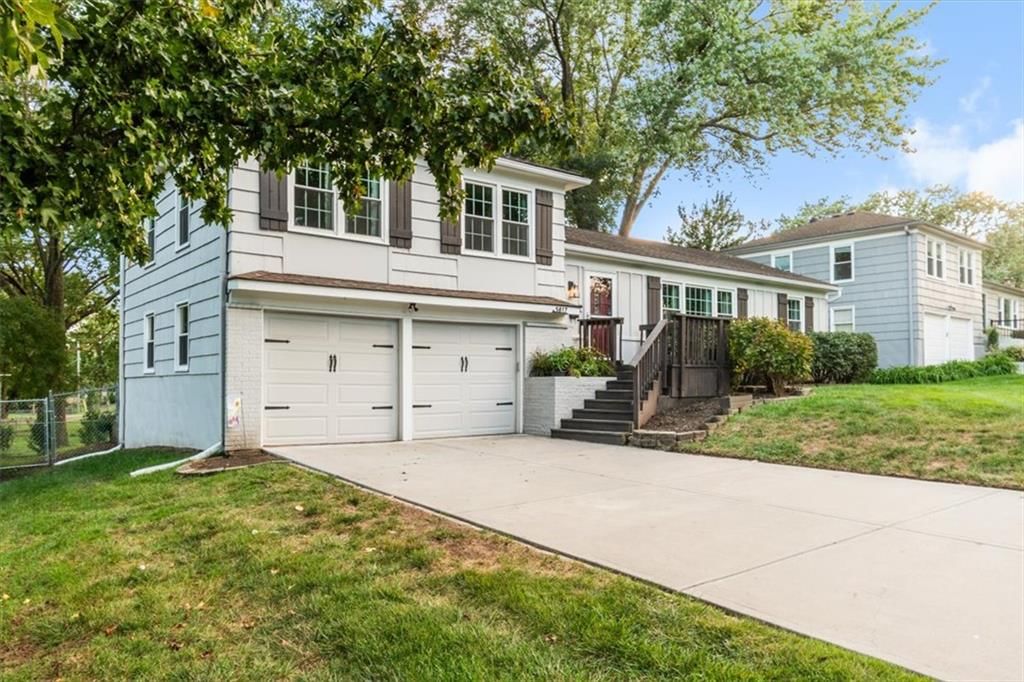
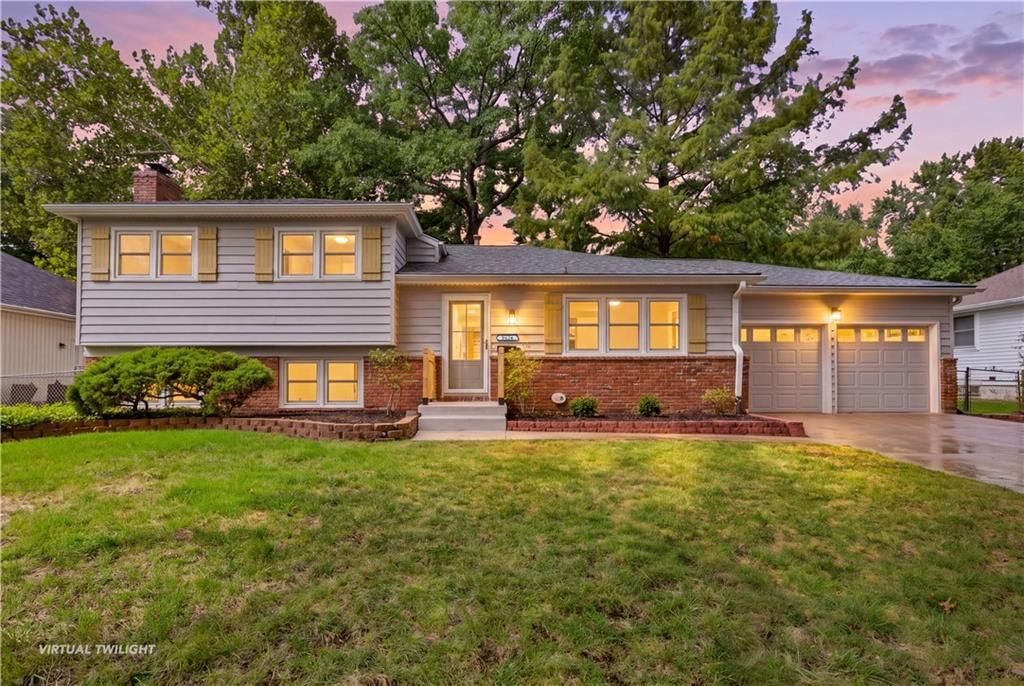
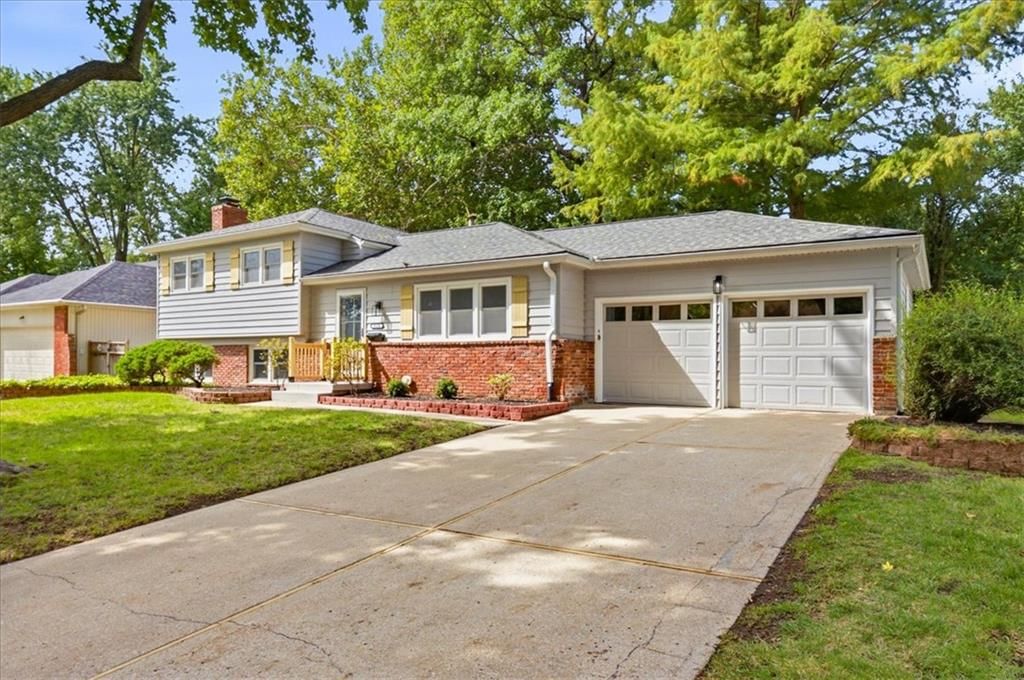
HouseLoop Vision identified 2 homes for sale in Nall Hills, KS with white kitchen cabinets, 1 with a freestanding tub, 9 with a big backyard, 4 with a finished basement, 3 with a kitchen island and 7 with a fenced yard, plus 4 more features.
HouseLoop Vision has looked at the photos of all 9 homes for sale in Nall Hills.
2
of 9 looked at, all 2 seen in the photos
See the 2 homesPhoto 10White kitchen cabinets, seen in photo 10
List price $599,950 · 3 beds · 2,619 sqft
1
of 9 looked at, all 1 seen in the photos
See the home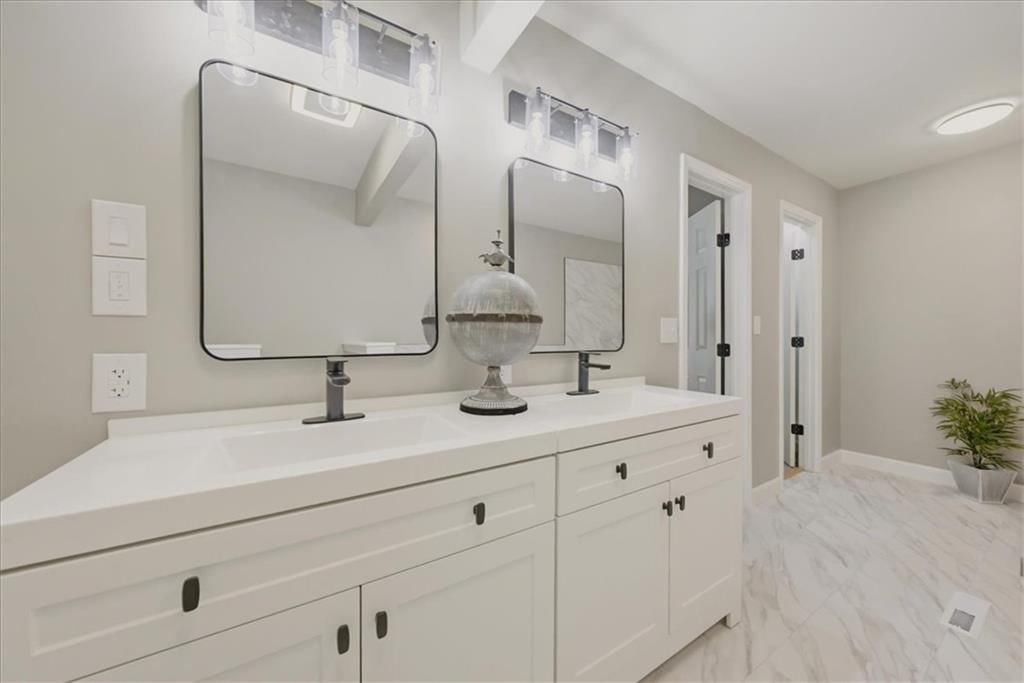 Photo 19
Freestanding tub, seen in photo 19
List price $489,900 · 4 beds · 2,205 sqft
7
of 9 looked at, 4 of them seen in the photos
See the 7 homes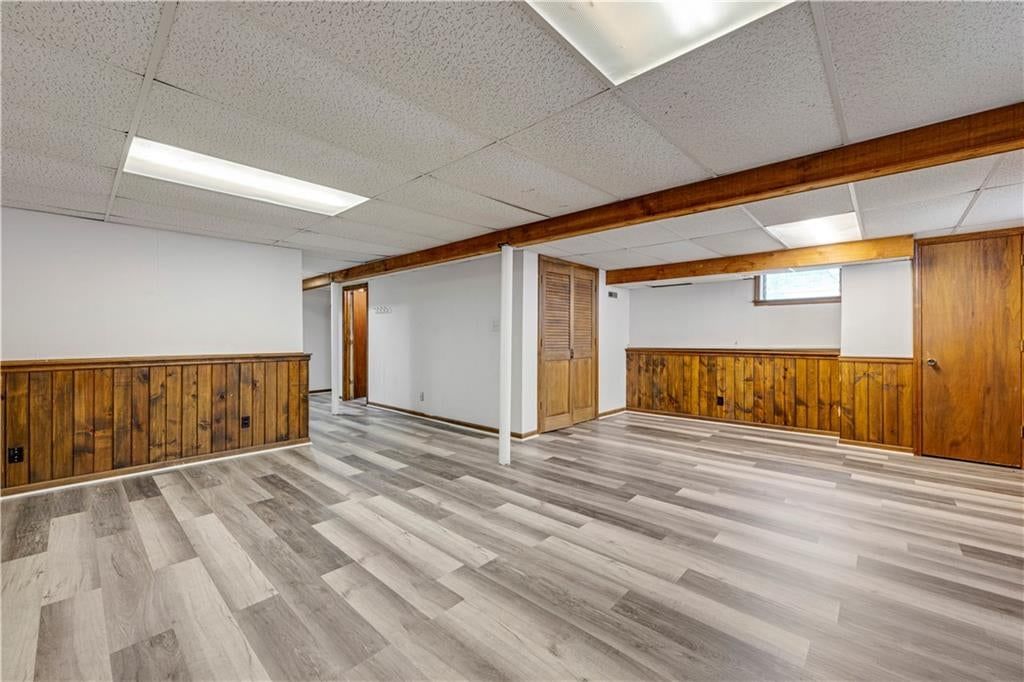 Photo 17
Finished basement, seen in photo 17
Listed in the MLS: Finished
List price $360,000 · 3 beds · 2,122 sqft
8
of 9 looked at, 7 of them seen in the photos
See the 8 homes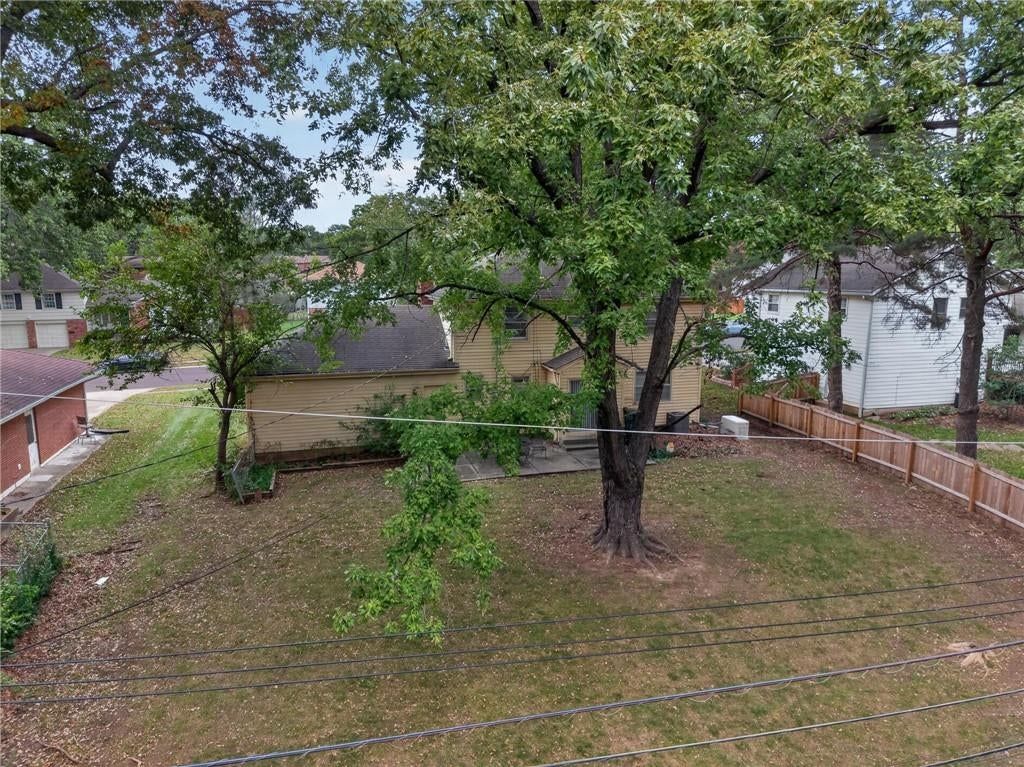 Photo 5
Fenced yard, seen in photo 5
List price $275,000 · 4 beds · 1,672 sqft
8
of 9 looked at, all 8 seen in the photos
See the 8 homes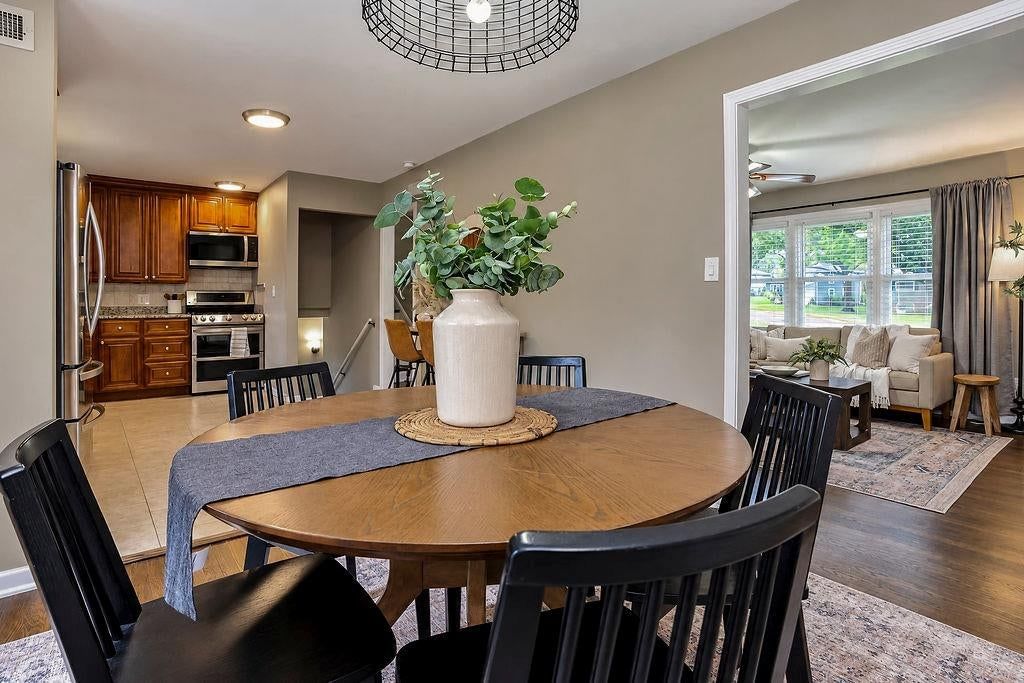 Photo 9
Open floor plan, seen in photo 9
List price $374,990 · 3 beds · 1,320 sqft
As of Oct 24, 2026, these are features HouseLoop Vision found in the listing photos of Nall Hills homes for sale that the homes' MLS data doesn't list.
| School |
|---|
| School districts |
| Nall Hills is served by the Shawnee Mission school district. |
| See all 3 schools serving Nall Hills |
| Neighborhood | Market (Market type is set by months of supply — how long it would take to sell every home for sale at the current pace. Under ~4 months favors sellers (low inventory, faster sales, homes near or above asking); over ~6 favors buyers (more choice, more negotiating room). 4–6 is balanced.) | Months supply | For sale | Median sale | Sell-to-list | Days to contract | Coming soon | Under contract |
|---|---|---|---|---|---|---|---|---|
| Chapel Hill | Balanced | 4.8 mo | 18 | Median$750,000 | 100% | 32d | 0 | 3 |
| Quivira Falls | Strong Seller's | 1.5 mo | 4 | Median$250,350 | 100% | 16d | 1 | 5 |
| Oak Park | Seller's | 2.1 mo | 5 | Median$415,000 | 101% | 17d | 1 | 3 |
| Terrybrook Farms | Buyer's | 7.8 mo | 11 | Median$1,127,500 | 94% | 53d | 0 | 4 |
| CENTURY FARMS | Seller's | 2.9 mo | 8 | Median$1,209,000 | 101% | 33d | 0 | 8 |
| Place | Market (Market type is set by months of supply — how long it would take to sell every home for sale at the current pace. Under ~4 months favors sellers (low inventory, faster sales, homes near or above asking); over ~6 favors buyers (more choice, more negotiating room). 4–6 is balanced.) | Months supply | Median list | Sell-to-list | Days to contract | For sale | Coming soon | Under contract |
|---|---|---|---|---|---|---|---|---|
| Overland Park | Seller's | 2.5 mo | Median$733,510 | 102% | 16d | 535 | 37 | 324 |
| Olathe | Seller's | 3.1 mo | Median$628,000 | 100% | 18d | 562 | 30 | 292 |
| Shawnee | Seller's | 2.6 mo | Median$565,000 | 100% | 16d | 198 | 20 | 107 |
| Lenexa | Seller's | 2.9 mo | Median$635,050 | 99% | 21d | 199 | 12 | 82 |
| Leawood | Seller's | 2.9 mo | Median$912,000 | 99% | 18d | 141 | 12 | 71 |
| Place | Market (Market type is set by months of supply — how long it would take to sell every home for sale at the current pace. Under ~4 months favors sellers (low inventory, faster sales, homes near or above asking); over ~6 favors buyers (more choice, more negotiating room). 4–6 is balanced.) | Months supply | Median list | Sell-to-list | Days to contract | For sale | Coming soon | Under contract |
|---|---|---|---|---|---|---|---|---|
| 66212 | Strong Seller's | 1.4 mo | Median$365,000 | 100% | 15d | 53 | 3 | 41 |
| 66221 | Balanced | 4.1 mo | Median$972,500 | 101% | 29d | 133 | 6 | 62 |
| 66213 | Strong Seller's | 1.5 mo | Median$555,000 | 100% | 15d | 38 | 5 | 29 |
| 66223 | Strong Seller's | 1.4 mo | Median$502,000 | 99% | 16d | 29 | 3 | 27 |