Lionsgate, Overland Park KS Real Estate & Homes For Sale

1 home for sale in Lionsgate · Sorted by Newest Listed

Real estate in Lionsgate, Overland Park, Kansas

Lionsgate, Overland Park has 1 home for sale right now, and it is coming soon. These homes were built in 1998. They are 5,274 square feet.

Living in Lionsgate

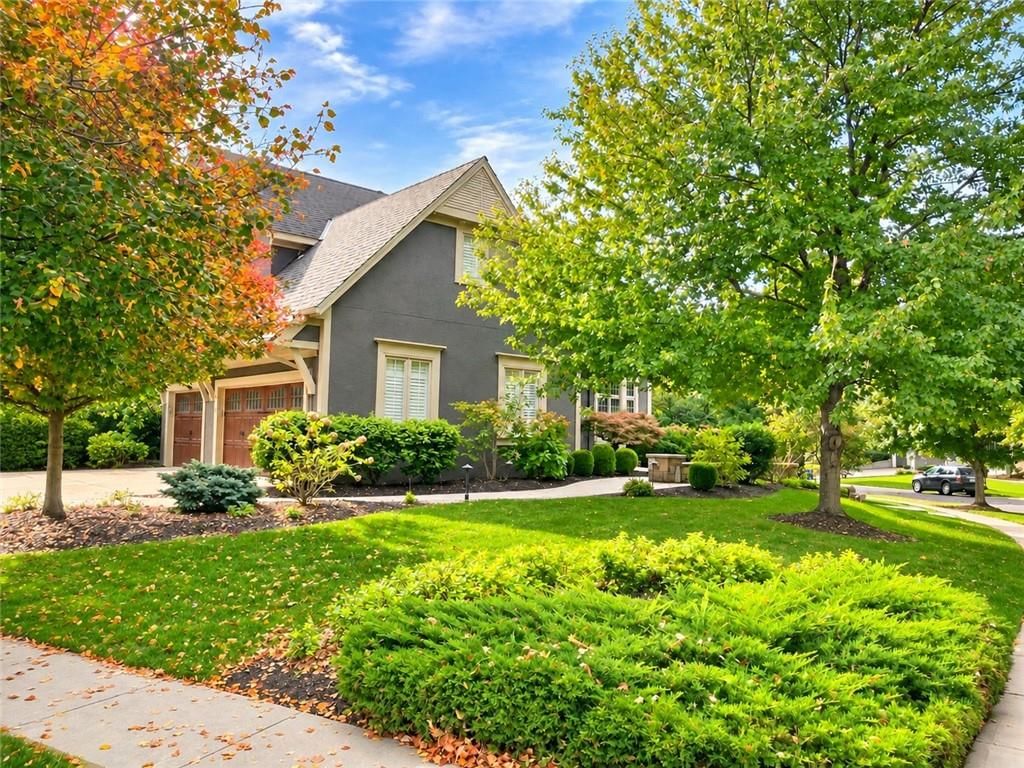
14719 Outlook Street, Overland Park, KS
Coming soon
$875,000Active 11/13
4beds|4.5baths|5,274sqft|Coming soon
14719 Outlook St, Overland Park, KS

New · 3h ago

HouseLoop Vision — AI-detected features from Lionsgate listing photos

As of Nov 2, 2026

HouseLoop Vision identified 1 home for sale in Lionsgate, KS with a big backyard and 1 brick home.

HouseLoop Vision has looked at the photos of the 1 home for sale in Lionsgate.

  • 1

    Homes with a Big Backyard

    of 1 looked at, all 1 seen in the photos

Key HouseLoop Vision features

  • Big backyard
  • Finished basement
  • 3-car garage
  • Brick homes
  • Community pool
  • Corner lot
  • Homes on a cul-de-sac
  • Eat-in kitchen
  • Garage faces side
  • Outdoor fireplace

Where HouseLoop Vision saw them

  • Big backyard: 14719 Outlook Street (photo 1).

What HouseLoop Vision found that the MLS didn't

As of Nov 2, 2026, these are features HouseLoop Vision found in the listing photos of Lionsgate homes for sale that the homes' MLS data doesn't list.

  • Homes with a Big Backyard: 1 home doesn't mention it in their MLS listing. HouseLoop Vision found it in their photos.

HouseLoop Vision reads the listing photos. Listing data: Heartland MLS.

Every picture is analyzed by HouseLoop's proprietary AI Vision classification system. The features above are in addition to the features provided by the MLS.

How HouseLoop Vision works

See all Lionsgate features

① Lionsgate itself — the place you are on

Schools serving Lionsgate

School
School districts
Lionsgate is served by the Blue Valley school district.
See all 2 schools serving Lionsgate
② Its neighborhoods — one step out

Nearby neighborhoods to Lionsgate

NeighborhoodMarket (Market type is set by months of supply — how long it would take to sell every home for sale at the current pace. Under ~4 months favors sellers (low inventory, faster sales, homes near or above asking); over ~6 favors buyers (more choice, more negotiating room). 4–6 is balanced.)Months supplyFor saleMedian saleSell-to-listDays to contractComing soonUnder contract
Nall HillsStrong Seller's1.9 mo7Median$425,00099%15d05
Chapel HillBalanced ▲4.6 mo17Median$750,000100%32d04
Quivira FallsStrong Seller's1.5 mo4Median$251,675101%18d15
Oak ParkStrong Seller's1.7 mo4Median$417,500101%17d05
Terrybrook FarmsStrong Buyer's8.5 mo12Median$1,165,00093%53d03
How we compute these
Market.
Market type is set by months of supply — how long it would take to sell every home for sale at the current pace. Under ~4 months favors sellers (low inventory, faster sales, homes near or above asking); over ~6 favors buyers (more choice, more negotiating room). 4–6 is balanced.
Months supply.
How many months it would take to sell every home now for sale at the pace of the last 90 days: homes for sale ÷ (closings in the last 90 days ÷ 3).
For sale.
Homes listed as active right now. A live count, not a monthly average.
Days to contract.
The middle number of days between a home being listed and going under contract, over the last 90 days of closings. It is not days-to-close, and it is not how long today's listings have been sitting. Newly built homes are excluded, because a build finishing is not a market moving.
Coming soon.
Homes announced but not yet accepting showings. A live count.
Under contract.
Homes with an accepted contract that have not closed yet. A live count.
③ Nearby cities — two steps out

Search homes nearby Lionsgate

PlaceMarket (Market type is set by months of supply — how long it would take to sell every home for sale at the current pace. Under ~4 months favors sellers (low inventory, faster sales, homes near or above asking); over ~6 favors buyers (more choice, more negotiating room). 4–6 is balanced.)Months supplyMedian listSell-to-listDays to contractFor saleComing soonUnder contract
Overland ParkSeller's2.3 moMedian$747,182101%16d51044317
OlatheSeller's3 moMedian$625,35599%18d55532283
ShawneeSeller's2.4 moMedian$560,000100%16d18215101
LenexaSeller's2.8 moMedian$625,90598%21d1951490
LeawoodSeller's2.9 moMedian$937,500100%18d1391363
How we compute these
Market.
Market type is set by months of supply — how long it would take to sell every home for sale at the current pace. Under ~4 months favors sellers (low inventory, faster sales, homes near or above asking); over ~6 favors buyers (more choice, more negotiating room). 4–6 is balanced.
Months supply.
How many months it would take to sell every home now for sale at the pace of the last 90 days: homes for sale ÷ (closings in the last 90 days ÷ 3).
Median list.
The middle asking price among the homes for sale right now. Half are listed above it, half below.
Days to contract.
The middle number of days between a home being listed and going under contract, over the last 90 days of closings. It is not days-to-close, and it is not how long today's listings have been sitting. Newly built homes are excluded, because a build finishing is not a market moving.
For sale.
Homes listed as active right now. A live count, not a monthly average.
Coming soon.
Homes announced but not yet accepting showings. A live count.
Under contract.
Homes with an accepted contract that have not closed yet. A live count.
④ Zip codes

Nearby ZIP codes

PlaceMarket (Market type is set by months of supply — how long it would take to sell every home for sale at the current pace. Under ~4 months favors sellers (low inventory, faster sales, homes near or above asking); over ~6 favors buyers (more choice, more negotiating room). 4–6 is balanced.)Months supplyMedian listSell-to-listDays to contractFor saleComing soonUnder contract
66212Strong Seller's1.1 moMedian$360,000100%15d39244
66221Seller's3.7 moMedian$985,000101%28d120559
66213Strong Seller's1.6 moMedian$565,00099%16d471225
66223Strong Seller's1.3 moMedian$566,50098%16d27324
How we compute these
Market.
Market type is set by months of supply — how long it would take to sell every home for sale at the current pace. Under ~4 months favors sellers (low inventory, faster sales, homes near or above asking); over ~6 favors buyers (more choice, more negotiating room). 4–6 is balanced.
Months supply.
How many months it would take to sell every home now for sale at the pace of the last 90 days: homes for sale ÷ (closings in the last 90 days ÷ 3).
Median list.
The middle asking price among the homes for sale right now. Half are listed above it, half below.
Days to contract.
The middle number of days between a home being listed and going under contract, over the last 90 days of closings. It is not days-to-close, and it is not how long today's listings have been sitting. Newly built homes are excluded, because a build finishing is not a market moving.
For sale.
Homes listed as active right now. A live count, not a monthly average.
Coming soon.
Homes announced but not yet accepting showings. A live count.
Under contract.
Homes with an accepted contract that have not closed yet. A live count.

Real estate FAQs about Lionsgate

How many homes are for sale in Lionsgate, Overland Park?

There is currently 1 home for sale in Lionsgate, Overland Park on HouseLoop, as of Nov 2, 2026, from Heartland MLS.

How many homes have sold in Lionsgate, Overland Park in the past year?

5 homes have sold in Lionsgate, Overland Park over the last 12 months. Browse the recently-sold homes to see what's moving in the area.

Verify school attendance boundaries before relying on them — boundaries can change year-to-year.