
Forest Hills – The Village of, Olathe KS Real Estate & Homes For Sale
2 homes for sale in Forest Hills – The Village of · Sorted by Newest Listed




Start with the numbers that matter to you
Real estate in Forest Hills – The Village of, Olathe, Kansas
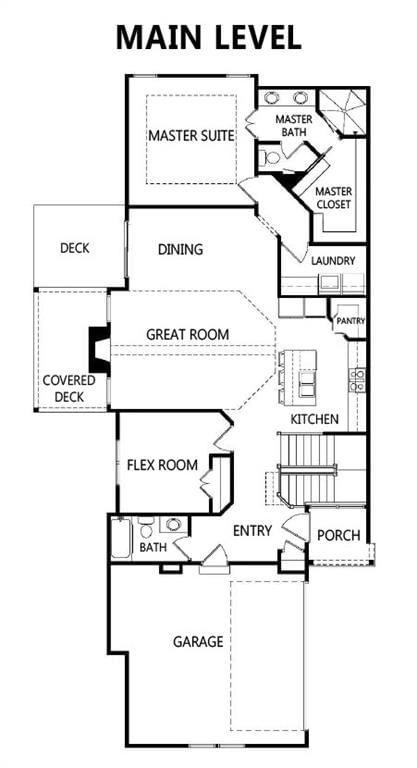
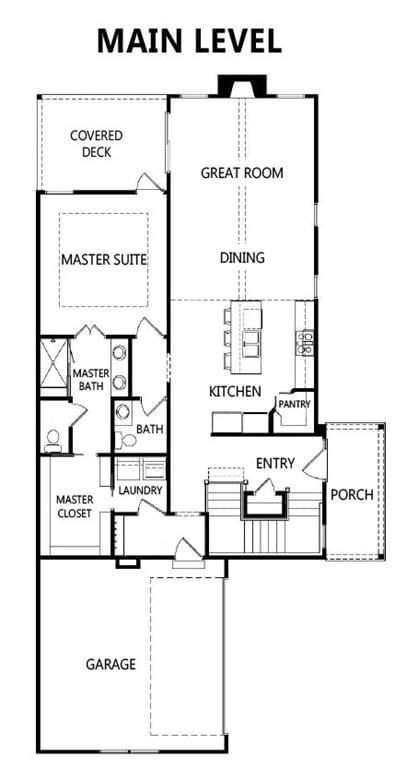
Forest Hills – The Village of, Olathe has 2 homes for sale right now, with a median list price of $506,000 as of Sep 28 These homes were built between 2024 and 2025, ranging from 2,164 to 2,386 square feet.
Sources — listings, prices and days on market: Heartland MLS as distributed by MLS GRID, as of September 28, 2026 · analysis and home values: HouseLoop calculations
Housing market trends in Forest Hills – The Village of, Olathe, Kansas
Forest Hills – The Village of, Olathe: 2 homes for sale · 2 price reductions. 1 home closed in the last 30 days.
2
Homes for sale in Forest Hills – The Village of
$506,000
Median list price
| Measure | Sep 2025 |
|---|---|
| Homes sold | 3 |
| New listings | 6 |
| Went under contract | 2 |
Real estate FAQs about Forest Hills – The Village of
What school district serves Forest Hills – The Village of?
What high school is Forest Hills – The Village of zoned for?
What middle school is Forest Hills – The Village of zoned for?
What elementary school is Forest Hills – The Village of zoned for?
How many homes are for sale in Forest Hills – The Village of?
What is the median list price in Forest Hills – The Village of?
How long does it take to sell a home in Forest Hills – The Village of?
Is now a good time to sell my home in Forest Hills – The Village of?
Is now a good time to buy a home in Forest Hills – The Village of?
Are home values increasing in Forest Hills – The Village of?
Does Forest Hills – The Village of have good resale value?
Who is the best realtor to sell my home in Forest Hills – The Village of?
Who is the most active listing team in Forest Hills – The Village of?
How does Forest Hills – The Village of (Olathe, KS) compare to its city?
② Its neighborhoods — one step out
Nearby neighborhoods to Forest Hills – The Village of
| Neighborhood | Median sale |
|---|---|
| Havencroft | $380,000 |
| Boulder Hills | $625,338 |
| Stonebridge Trails | $637,626 |
| Boulder Creek | $628,129 |
| Prairie Farms | $617,450 |
| Persimmon Hill | $425,000 |
How we compute these
- Market.
- Market type is set by months of supply — how long it would take to sell every home for sale at the current pace. Under ~4 months favors sellers (low inventory, faster sales, homes near or above asking); over ~6 favors buyers (more choice, more negotiating room). 4–6 is balanced.
- Months supply.
- How many months it would take to sell every home now for sale at the pace of the last 90 days: homes for sale ÷ (closings in the last 90 days ÷ 3).
- For sale.
- Homes listed as active right now. A live count, not a monthly average.
- Days to contract.
- The middle number of days between a home being listed and going under contract, over the last 90 days of closings. It is not days-to-close, and it is not how long today's listings have been sitting. Newly built homes are excluded, because a build finishing is not a market moving.
- Coming soon.
- Homes announced but not yet accepting showings. A live count.
- Under contract.
- Homes with an accepted contract that have not closed yet. A live count.
③ Nearby cities — two steps out
Search homes nearby Forest Hills – The Village of
| Place | Median list |
|---|---|
| Olathe | $629,970 |
| Overland Park | $737,640 |
| Shawnee | $549,975 |
| Lenexa | $651,475 |
| Leawood | $950,000 |
| Prairie Village | $1,002,500 |
How we compute these
- Market.
- Market type is set by months of supply — how long it would take to sell every home for sale at the current pace. Under ~4 months favors sellers (low inventory, faster sales, homes near or above asking); over ~6 favors buyers (more choice, more negotiating room). 4–6 is balanced.
- Months supply.
- How many months it would take to sell every home now for sale at the pace of the last 90 days: homes for sale ÷ (closings in the last 90 days ÷ 3).
- Median list.
- The middle asking price among the homes for sale right now. Half are listed above it, half below.
- Days to contract.
- The middle number of days between a home being listed and going under contract, over the last 90 days of closings. It is not days-to-close, and it is not how long today's listings have been sitting. Newly built homes are excluded, because a build finishing is not a market moving.
- For sale.
- Homes listed as active right now. A live count, not a monthly average.
- Coming soon.
- Homes announced but not yet accepting showings. A live count.
- Under contract.
- Homes with an accepted contract that have not closed yet. A live count.
④ Zip codes, every city, then wider — widest
Nearby ZIP codes
| Place | Median list |
|---|---|
| 66062 | $639,900 |
| 66061 | $614,000 |
| 66026 | $750,000 |
How we compute these
- Market.
- Market type is set by months of supply — how long it would take to sell every home for sale at the current pace. Under ~4 months favors sellers (low inventory, faster sales, homes near or above asking); over ~6 favors buyers (more choice, more negotiating room). 4–6 is balanced.
- Months supply.
- How many months it would take to sell every home now for sale at the pace of the last 90 days: homes for sale ÷ (closings in the last 90 days ÷ 3).
- Median list.
- The middle asking price among the homes for sale right now. Half are listed above it, half below.
- Days to contract.
- The middle number of days between a home being listed and going under contract, over the last 90 days of closings. It is not days-to-close, and it is not how long today's listings have been sitting. Newly built homes are excluded, because a build finishing is not a market moving.
- For sale.
- Homes listed as active right now. A live count, not a monthly average.
- Coming soon.
- Homes announced but not yet accepting showings. A live count.
- Under contract.
- Homes with an accepted contract that have not closed yet. A live count.
Search homes for sale in every city we cover
How we compute these
- Market.
- Market type is set by months of supply — how long it would take to sell every home for sale at the current pace. Under ~4 months favors sellers (low inventory, faster sales, homes near or above asking); over ~6 favors buyers (more choice, more negotiating room). 4–6 is balanced.
- Months supply.
- How many months it would take to sell every home now for sale at the pace of the last 90 days: homes for sale ÷ (closings in the last 90 days ÷ 3).
- Median list.
- The middle asking price among the homes for sale right now. Half are listed above it, half below.
- Days to contract.
- The middle number of days between a home being listed and going under contract, over the last 90 days of closings. It is not days-to-close, and it is not how long today's listings have been sitting. Newly built homes are excluded, because a build finishing is not a market moving.
- For sale.
- Homes listed as active right now. A live count, not a monthly average.
- Coming soon.
- Homes announced but not yet accepting showings. A live count.
- Under contract.
- Homes with an accepted contract that have not closed yet. A live count.
Search for homes in popular markets
| Market | For sale |
|---|---|
| Heritage Ranch | 29 |
| Canyon Lakes | 27 |
| Seven Bridges | 24 |
| Garrett Ranch | 24 |
| Tomahawk Valley | 22 |
| Ruskin Heights | 22 |
How we compute these
- Market.
- Market type is set by months of supply — how long it would take to sell every home for sale at the current pace. Under ~4 months favors sellers (low inventory, faster sales, homes near or above asking); over ~6 favors buyers (more choice, more negotiating room). 4–6 is balanced.
- For sale.
- Homes listed as active right now. A live count, not a monthly average.
Or go wider still county, metro and state
How we compute these
- Market.
- Market type is set by months of supply — how long it would take to sell every home for sale at the current pace. Under ~4 months favors sellers (low inventory, faster sales, homes near or above asking); over ~6 favors buyers (more choice, more negotiating room). 4–6 is balanced.
- Months supply.
- How many months it would take to sell every home now for sale at the pace of the last 90 days: homes for sale ÷ (closings in the last 90 days ÷ 3).
- Median list.
- The middle asking price among the homes for sale right now. Half are listed above it, half below.
- Days to contract.
- The middle number of days between a home being listed and going under contract, over the last 90 days of closings. It is not days-to-close, and it is not how long today's listings have been sitting. Newly built homes are excluded, because a build finishing is not a market moving.
- For sale.
- Homes listed as active right now. A live count, not a monthly average.
- Coming soon.
- Homes announced but not yet accepting showings. A live count.
- Under contract.
- Homes with an accepted contract that have not closed yet. A live count.