
Homes with a Walk-Out Basement for Sale in Lenexa, KS
74 homes fit this search · Sorted by Newest Listed


21714 W 96th Street, Lenexa, KS
New · 21h ago


20104 W 90TH Street, Lenexa, KS
New · 2d ago


9622 Falcon Valley Drive, Lenexa, KS
New · 6d ago

20734 Pebble Lane, Lenexa, KS
New · 6d ago


20733 W 92nd Street, Lenexa, KS
New · 7d ago


25006 W 89th Street, Lenexa, KS

9317 Zarda Drive, Lenexa, KS


8626 Dice Lane, Lenexa, KS


8018 Alden Street, Lenexa, KS


9261 Brownridge Street, Lenexa, KS


10230 Marion Street, Lenexa, KS

24924 W 98th Place, Lenexa, KS


9924 Skyview Lane, Lenexa, KS


21221 W 81st Place, Lenexa, KS


8016 Monrovia Street, Lenexa, KS


9280 Brownridge Street, Lenexa, KS


12823 W 82nd Street, Lenexa, KS


14935 W 76th Street, Lenexa, KS


20613 W 96th Terrace, Lenexa, KS

8525 Cardinal Street, Lenexa, KS


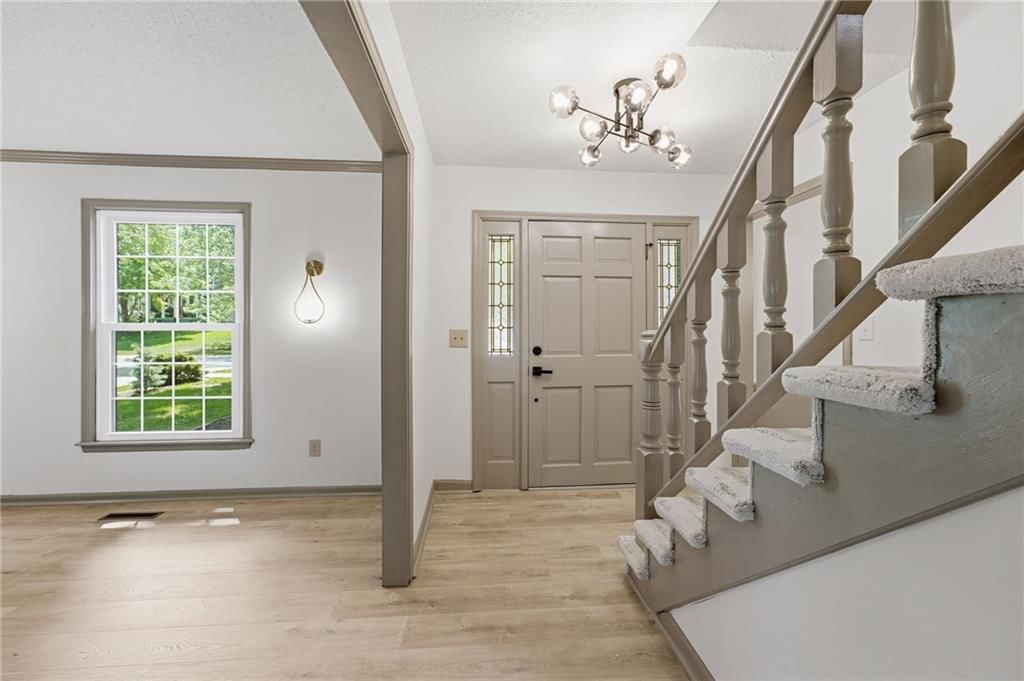
8009 Hallet Street, Lenexa, KS

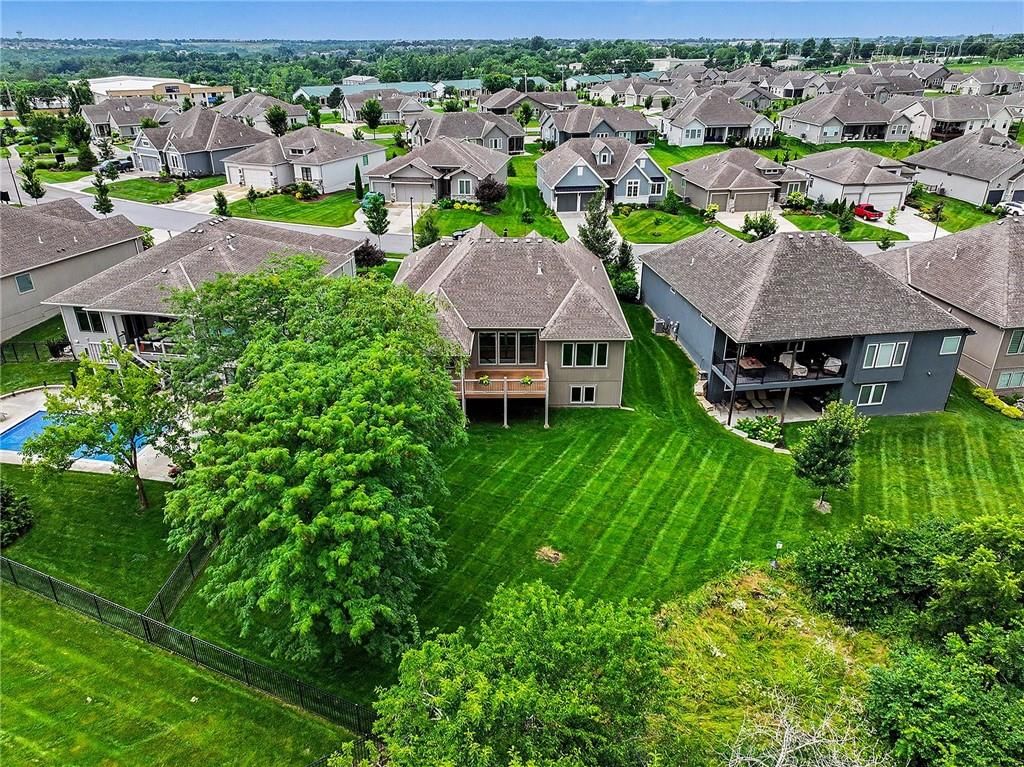

8193 Valley Road, Lenexa, KS

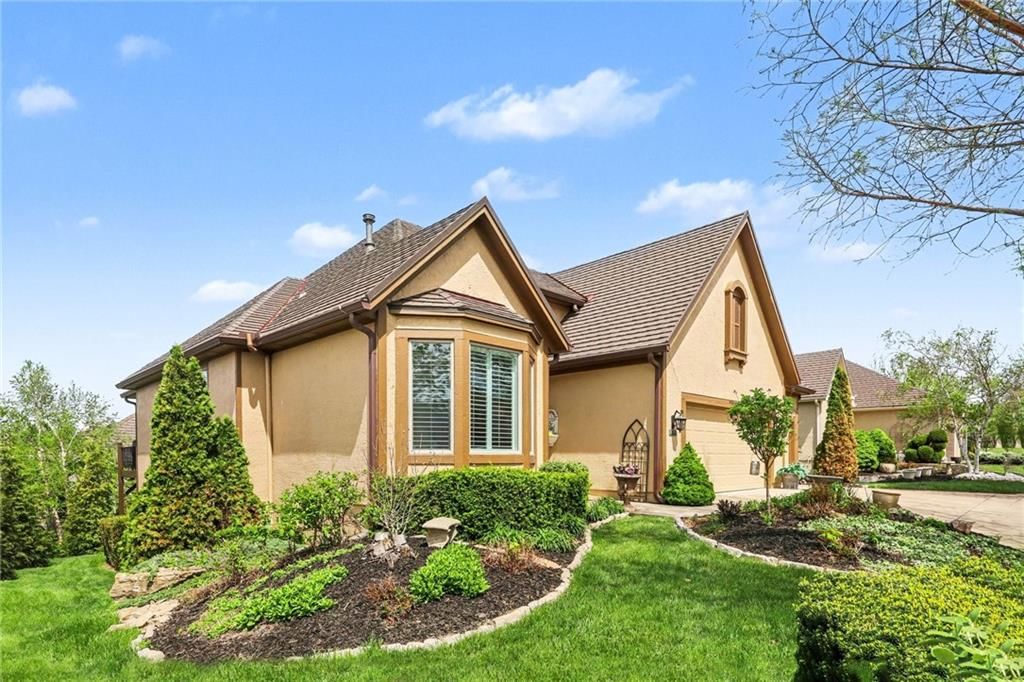
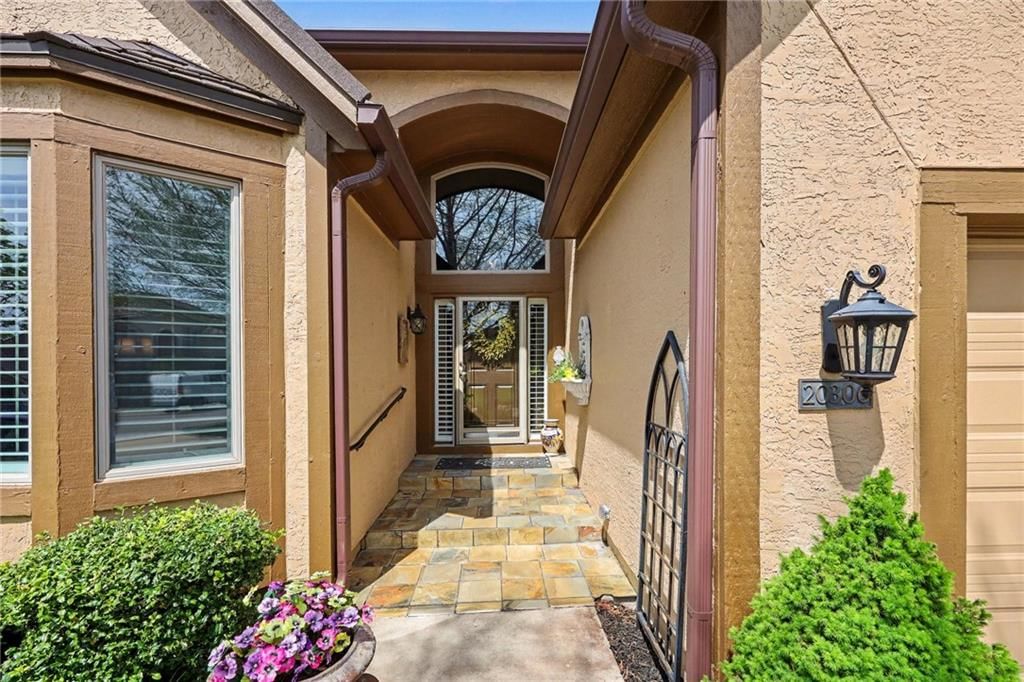
20306 W 99th Terrace, Lenexa, KS
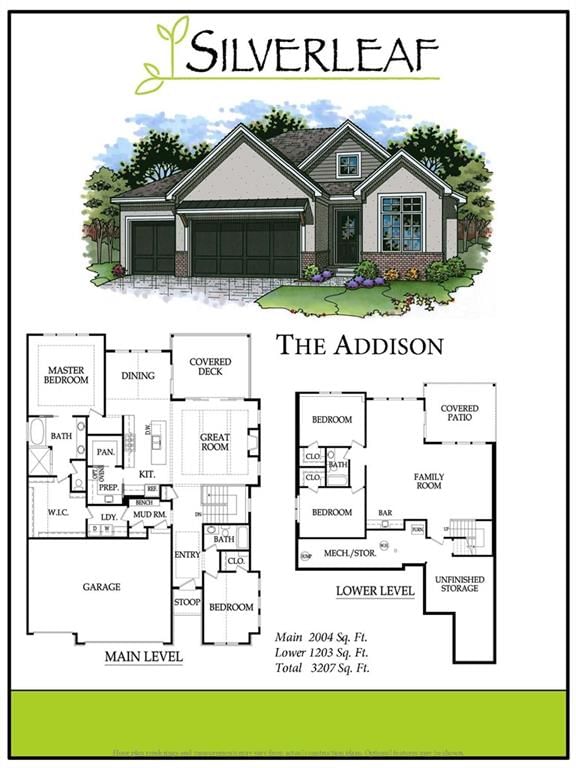
22069 W 94th Terrace, Lenexa, KS
About Homes with Walk-out Basement inLenexa, KS
Lenexa, KS has 74 homes with walk-out basement for sale right now, with a median list price of $649,625 as of Sep 17 These homes with walk-out basement were built between 1974 and 2026, ranging from 2,012 to 8,823 square feet.
Homes with Walk-out Basement market trendsLenexa, KS
Lenexa, KS: 160 homes for sale · 19 new in the last 7 days · median asking $651,475 · 62 price reductions · a median of 14 days to contract. 57 homes closed in the last 30 days, at a median of $530,000. At the pace of the last 90 days that is 2.01 months of supply.
| Measure | Aug 2026 |
|---|---|
| Median sale price | $552,000 |
| Median price per sq ft | $210 |
| Median days to contract | 19 |
| Sell-to-list ratio | 100% |
| Homes sold | 69 |
| New listings | 73 |
| Went under contract | 60 |
Homes with Walk-out Basement FAQsLenexa, KS
How many homes with walk-out basement are for sale in Lenexa, KS?
What is the median list price of homes with walk-out basement in Lenexa, KS?
Schoolsserving Lenexa
| School | Median list | |
|---|---|---|
| School districts | ||
| Olathe School District | $699,675 | |
| Shawnee Mission School District | $482,500 | |
| De Soto School District | Median— | |
| High schools | ||
| Olathe Northwest | $699,000 | |
| Shawnee Mission West | $599,000 | |
| Shawnee Mission Northwest | Median— | |
| De Soto | Median— | |
| Mill Valley | Median— | |
| Shawnee Mission South | Median— | |
| Middle schools | ||
| Prairie Trail | $711,750 | |
| Westridge | $599,000 | |
| Mill Creek | Median— | |
How we compute these
- Median list.
- The middle asking price among the homes for sale right now. Half are listed above it, half below.
- For sale.
- Homes listed as active right now. A live count, not a monthly average.
Newly listedin Lenexa, KS
| Address | Price |
|---|---|
| 9901 Countryside Road | Price$395,000 |
| 22675 W 89th Street | Price$685,150 |
| 12021 W 100TH Street | Price$480,000 |
| 22692 W 87th Street | Price$514,500 |
| 22695 W 87th Street | Price$521,450 |
| 8435 Pickering Street | Price$659,450 |
| 8523 Pickering Street | Price$585,875 |
| 8948 Inkster Street | Price$325,000 |
| 8529 Hall Street | Price$525,000 |
| 9622 Falcon Valley Drive | Price$525,000 |
| 7910 Rene Street | Price$400,000 |
| 20733 W 92nd Street | Price$769,950 |
Recently went under contractin Lenexa, KS
| Address | List price |
|---|---|
| 24141 95th Street | List price$540,000 |
| 14624 W 83rd Terrace | List price$410,000 |
| 22041 W 99th Terrace | List price$1,448,473 |
| 13112 W 77th Street | List price$425,000 |
| 8862 Gallery Street | List price$264,000 |
| 8860 Gallery Street | List price$274,000 |
| 20215 W 89th Terrace | List price$750,000 |
| 9926 Brockway Street | List price$988,700 |
| 12701 W 92nd Street | List price$215,000 |
| 8038 Monrovia Street | List price$350,000 |
| 8003 Halsey Street | List price$350,000 |
| 10030 Warwick Street | List price$740,000 |
How we compute these
- Under contract.
- Homes with an accepted contract that have not closed yet. A live count.
- Days to contract.
- The middle number of days between a home being listed and going under contract, over the last 90 days of closings. It is not days-to-close, and it is not how long today's listings have been sitting. Newly built homes are excluded, because a build finishing is not a market moving.
Popular home searchesin Lenexa
| Search | For sale |
|---|---|
| Open houses | 24 |
| Luxury homes | 13 |
| Just listed homes | 18 |
| Price-reduced homes | 62 |
| Coming soon homes | 14 |
| Homes under contract | 68 |
How we compute these
- For sale.
- Homes listed as active right now. A live count, not a monthly average.
Homes by pricein Lenexa
How we compute these
- For sale.
- Homes listed as active right now. A live count, not a monthly average.
Homes by featurein Lenexa
How we compute these
- For sale.
- Homes listed as active right now. A live count, not a monthly average.
Search by property typein Lenexa
| Property type | Median sale |
|---|---|
| Single Family | $515,000 |
| Townhouse | $285,000 |
| Villa | Median— |
| Half Duplex | Median— |
| Lots / Land | Median— |
How we compute these
- Market.
- Market type is set by months of supply — how long it would take to sell every home for sale at the current pace. Under ~4 months favors sellers (low inventory, faster sales, homes near or above asking); over ~6 favors buyers (more choice, more negotiating room). 4–6 is balanced.
- Months supply.
- How many months it would take to sell every home now for sale at the pace of the last 90 days: homes for sale ÷ (closings in the last 90 days ÷ 3).
- For sale.
- Homes listed as active right now. A live count, not a monthly average.
- Days to contract.
- The middle number of days between a home being listed and going under contract, over the last 90 days of closings. It is not days-to-close, and it is not how long today's listings have been sitting. Newly built homes are excluded, because a build finishing is not a market moving.
- Coming soon.
- Homes announced but not yet accepting showings. A live count.
- Under contract.
- Homes with an accepted contract that have not closed yet. A live count.
Nearby neighborhoodsto Lenexa
| Neighborhood | Median sale |
|---|---|
| Four Colonies | $277,500 |
| The Timbers at Clear Creek | $690,350 |
| Bristol Highlands | $544,794 |
| The Cedars | $458,500 |
| WaterCrest Landing | $824,975 |
| Silverleaf | $790,710 |
How we compute these
- Market.
- Market type is set by months of supply — how long it would take to sell every home for sale at the current pace. Under ~4 months favors sellers (low inventory, faster sales, homes near or above asking); over ~6 favors buyers (more choice, more negotiating room). 4–6 is balanced.
- Months supply.
- How many months it would take to sell every home now for sale at the pace of the last 90 days: homes for sale ÷ (closings in the last 90 days ÷ 3).
- For sale.
- Homes listed as active right now. A live count, not a monthly average.
- Days to contract.
- The middle number of days between a home being listed and going under contract, over the last 90 days of closings. It is not days-to-close, and it is not how long today's listings have been sitting. Newly built homes are excluded, because a build finishing is not a market moving.
- Coming soon.
- Homes announced but not yet accepting showings. A live count.
- Under contract.
- Homes with an accepted contract that have not closed yet. A live count.
Search homesnearby Lenexa
| Place | Median list |
|---|---|
| Lenexa | $649,625 |
| Overland Park | $752,272 |
| Olathe | $635,150 |
| Shawnee | $559,950 |
| Leawood | $979,900 |
| Prairie Village | $1,197,000 |
How we compute these
- Market.
- Market type is set by months of supply — how long it would take to sell every home for sale at the current pace. Under ~4 months favors sellers (low inventory, faster sales, homes near or above asking); over ~6 favors buyers (more choice, more negotiating room). 4–6 is balanced.
- Months supply.
- How many months it would take to sell every home now for sale at the pace of the last 90 days: homes for sale ÷ (closings in the last 90 days ÷ 3).
- Median list.
- The middle asking price among the homes for sale right now. Half are listed above it, half below.
- Days to contract.
- The middle number of days between a home being listed and going under contract, over the last 90 days of closings. It is not days-to-close, and it is not how long today's listings have been sitting. Newly built homes are excluded, because a build finishing is not a market moving.
- For sale.
- Homes listed as active right now. A live count, not a monthly average.
- Coming soon.
- Homes announced but not yet accepting showings. A live count.
- Under contract.
- Homes with an accepted contract that have not closed yet. A live count.
NearbyZIP codes
| Place | Median list |
|---|---|
| 66215 | $399,475 |
| 66227 | $675,000 |
| 66220 | $875,000 |
| 66219 | $600,000 |
How we compute these
- Market.
- Market type is set by months of supply — how long it would take to sell every home for sale at the current pace. Under ~4 months favors sellers (low inventory, faster sales, homes near or above asking); over ~6 favors buyers (more choice, more negotiating room). 4–6 is balanced.
- Months supply.
- How many months it would take to sell every home now for sale at the pace of the last 90 days: homes for sale ÷ (closings in the last 90 days ÷ 3).
- Median list.
- The middle asking price among the homes for sale right now. Half are listed above it, half below.
- Days to contract.
- The middle number of days between a home being listed and going under contract, over the last 90 days of closings. It is not days-to-close, and it is not how long today's listings have been sitting. Newly built homes are excluded, because a build finishing is not a market moving.
- For sale.
- Homes listed as active right now. A live count, not a monthly average.
- Coming soon.
- Homes announced but not yet accepting showings. A live count.
- Under contract.
- Homes with an accepted contract that have not closed yet. A live count.
Search homes for salein every city we cover
How we compute these
- Market.
- Market type is set by months of supply — how long it would take to sell every home for sale at the current pace. Under ~4 months favors sellers (low inventory, faster sales, homes near or above asking); over ~6 favors buyers (more choice, more negotiating room). 4–6 is balanced.
- Months supply.
- How many months it would take to sell every home now for sale at the pace of the last 90 days: homes for sale ÷ (closings in the last 90 days ÷ 3).
- Median list.
- The middle asking price among the homes for sale right now. Half are listed above it, half below.
- Days to contract.
- The middle number of days between a home being listed and going under contract, over the last 90 days of closings. It is not days-to-close, and it is not how long today's listings have been sitting. Newly built homes are excluded, because a build finishing is not a market moving.
- For sale.
- Homes listed as active right now. A live count, not a monthly average.
- Coming soon.
- Homes announced but not yet accepting showings. A live count.
- Under contract.
- Homes with an accepted contract that have not closed yet. A live count.
Search for homesin popular markets
| Market | For sale |
|---|---|
| Heritage Ranch | 28 |
| Ruskin Heights | 25 |
| Canyon Lakes | 25 |
| Garrett Ranch | 24 |
| Tomahawk Valley | 23 |
| Seven Bridges | 23 |
How we compute these
- Market.
- Market type is set by months of supply — how long it would take to sell every home for sale at the current pace. Under ~4 months favors sellers (low inventory, faster sales, homes near or above asking); over ~6 favors buyers (more choice, more negotiating room). 4–6 is balanced.
- For sale.
- Homes listed as active right now. A live count, not a monthly average.
Or go wider stillcounty, metro and state
How we compute these
- Market.
- Market type is set by months of supply — how long it would take to sell every home for sale at the current pace. Under ~4 months favors sellers (low inventory, faster sales, homes near or above asking); over ~6 favors buyers (more choice, more negotiating room). 4–6 is balanced.
- Months supply.
- How many months it would take to sell every home now for sale at the pace of the last 90 days: homes for sale ÷ (closings in the last 90 days ÷ 3).
- Median list.
- The middle asking price among the homes for sale right now. Half are listed above it, half below.
- Days to contract.
- The middle number of days between a home being listed and going under contract, over the last 90 days of closings. It is not days-to-close, and it is not how long today's listings have been sitting. Newly built homes are excluded, because a build finishing is not a market moving.
- For sale.
- Homes listed as active right now. A live count, not a monthly average.
- Coming soon.
- Homes announced but not yet accepting showings. A live count.
- Under contract.
- Homes with an accepted contract that have not closed yet. A live count.